Right. So, the market. It appears to be having a bit of a lie-down, doesn’t it? Bitcoin’s dallying with the idea of falling below that magical $100,000 mark (a sum that, let’s be honest, feels increasingly like a politely fabricated rumour), despite all the hopeful glances towards it during 2025. And as BTC wobbles, Ethereum and Shiba Inu are following along like slightly embarrassed puppies. Not a full-on tumble, mind you, more of a slow, disheartening bleed. Like a particularly stubborn stain.
Is Ethereum Protected? (Don’t Bet On It)
Ethereum’s 200-day exponential moving average (EMA) – which, for a while, was behaving rather like a very polite bouncer – has officially been breached. A structural breakdown, they call it. Sounds dramatic, doesn’t it? It basically means the chance of a quick bounce-back is about as likely as a sensible conversation with a troll. We’re looking at a proper bearish phase, not just a small hiccup. A full-blown, capital-G Grim situation.
ETH has plummeted to approximately $3,518 after weeks of pretending things were still alright around $3,700-$3,800. Breaking the 200 EMA for the first time in nine months! Historically, staying above that line was supposed to launch it into the stratosphere. Now? It’s more like watching a slightly overweight pigeon try to take off. Persistent selling, they say. Or, as any sensible person would call it, people realizing that perhaps, just perhaps, this whole thing was a bit… optimistic. 📉
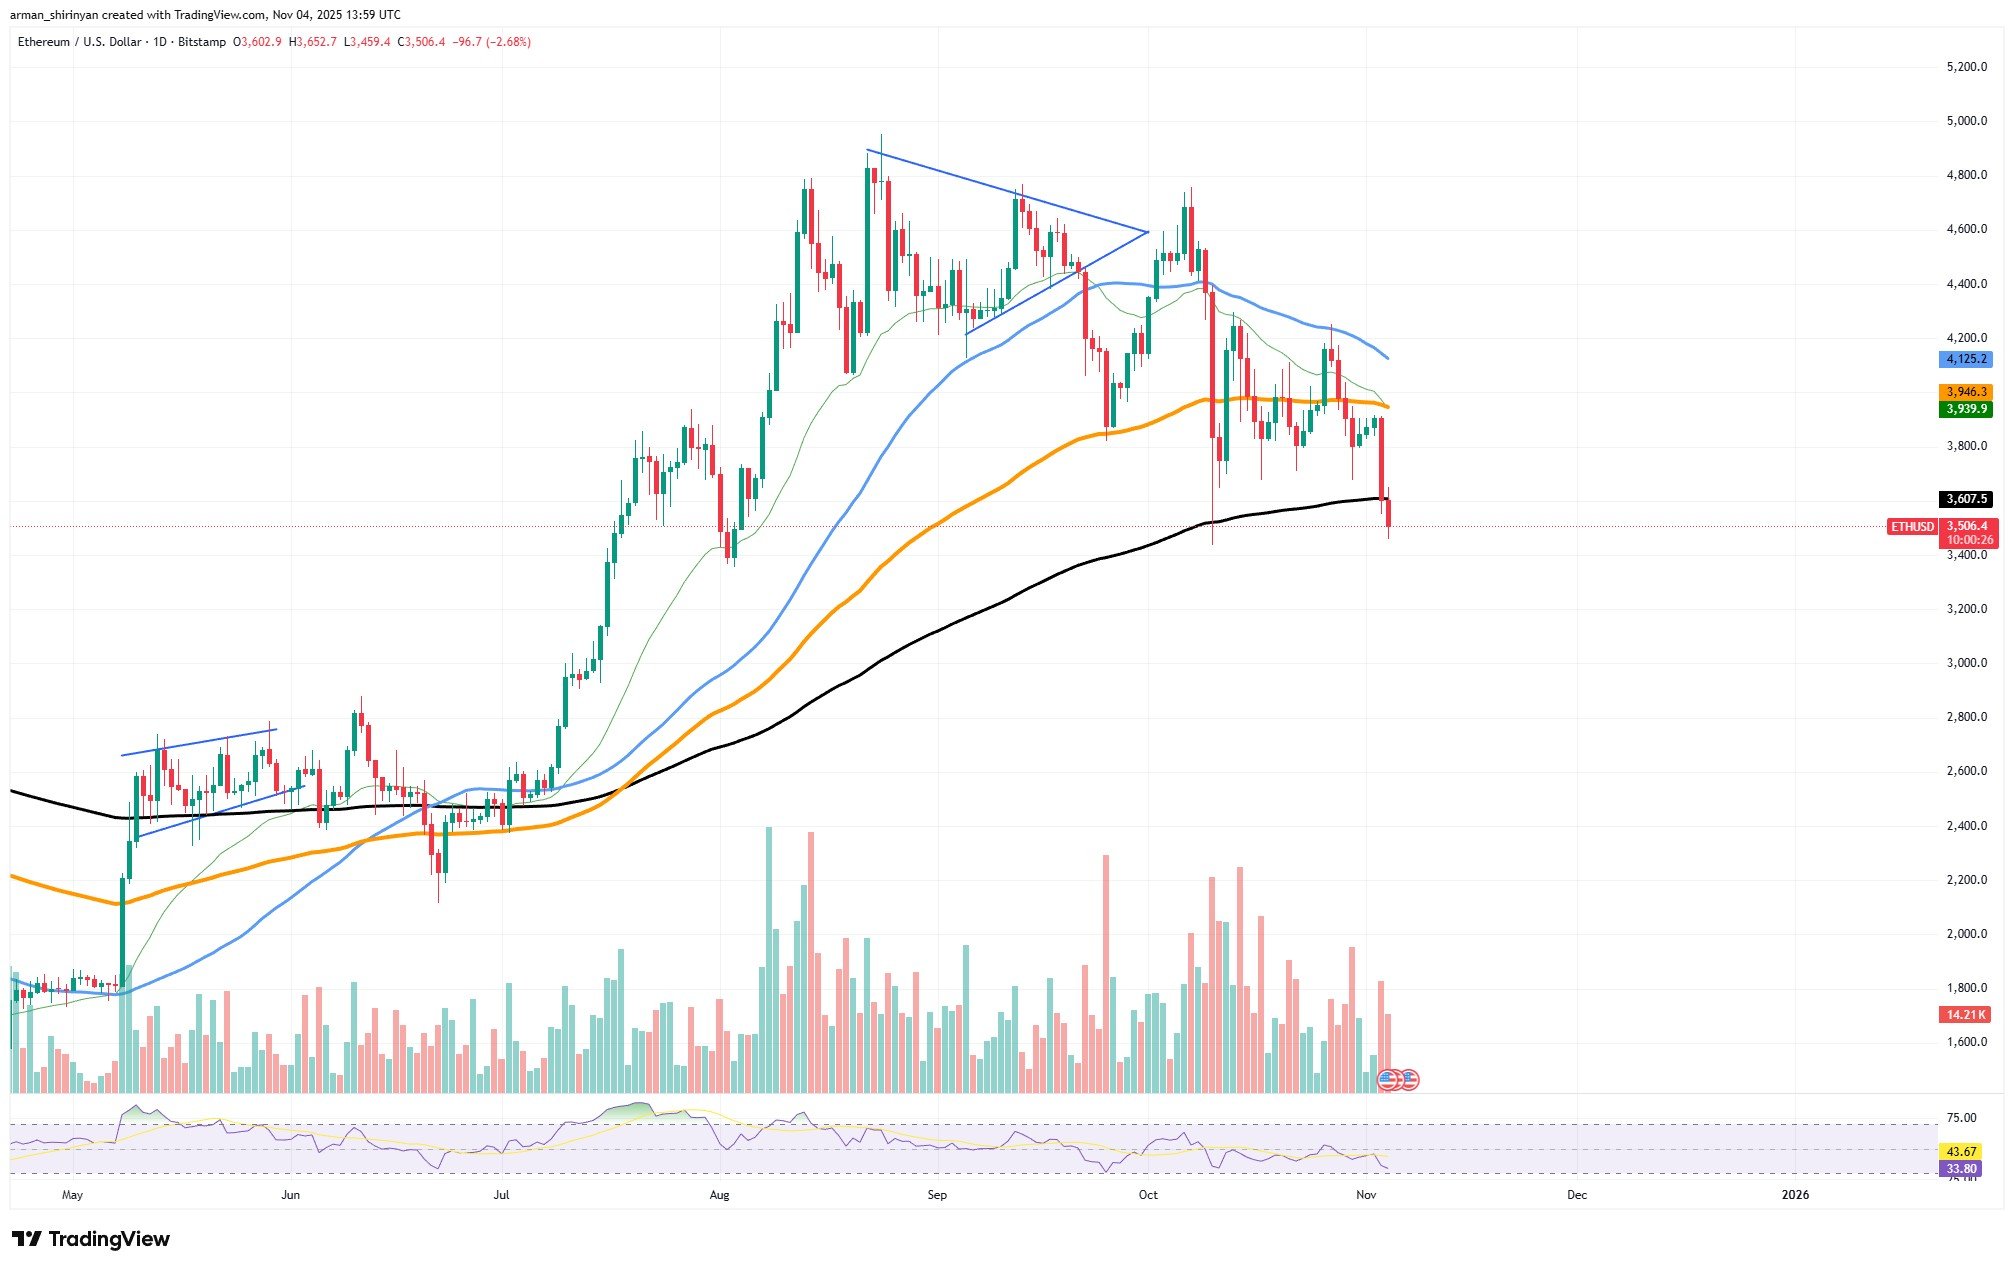
And the volume? Oh, the volume is selling. Not just a little selling, but the kind of selling that suggests people are frantically heading for the exits. The shorter-term moving averages are drooping like disappointed flowers, and are currently miles above where the price actually is. It’s all rather… conclusive. Ethereum’s officially gone from “maybe accumulating” to “probably declining for a while”. You’ve been warned.
The technical types suggest a possible stopping point around $3,400, with a slightly more desperate hope around $3,200. But honestly, given the complete lack of enthusiasm to rescue things at the EMA, a lot of buyers are probably thinking, “Let’s see how this plays out from the safety of a comfortable distance.”
The Relative Strength Index (RSI) is sulking around 34, but in bearish markets, that usually means “more declines coming.” Ethereum, you see, has just lost it. Both in the technical sense and, one suspects, in a more existential way. If the 200 EMA doesn’t make a swift recovery, we might be looking at a correction lasting well into 2026. That’s a lot of years to explain to your accountant. 📆
Bitcoin Waving At $100,000 (From a Distance)
BTC is currently hovering near $104,000, testing a rather wobbly area of support after finally admitting defeat against its 200-day moving average at $108,000. Everyone wonders if it will hold. A good question. A very good question. One that doesn’t have a particularly cheerful answer at the moment. 🤷
The structure has, to put it mildly, declined recently. A distinctly downtrend is forming. Apparently, optimism is out, caution is in. Revolutionary. The 200-day moving average, once a symbol of strength, is now acting as a rather effective barrier. Below that threshold, the path of least resistance, as they say, is downward.
The Relative Strength Index (RSI) is hovering around 35, which is nearly oversold. But oversold doesn’t always mean “instant recovery”, especially when everything looks a bit bleak. If Bitcoin can’t hold $100,000, the next stop is $97,000-$98,000. A bit of short-term interest might appear, but a proper recovery? That requires a miracle and a reclaim of the $108,000- $110,000 range. Which, presently, looks about as likely as a dragon understanding compound interest. 🐉
External factors, like a lack of available money and a general reluctance to take risks, aren’t helping. Long-term holders remain stubbornly optimistic (bless their hearts), but short-term volatility is likely to increase. If Bitcoin can hang on to $100,000, it might attempt a slow crawl upwards after a bit of consolidation. But that’s a big “if”.
Another Shiba Inu Sell Stage (Oh Dear)
Shiba Inu, it appears, is about to enter a “targeted sellout phase”. Which sounds rather unpleasant, doesn’t it? The token broke below an ascending trendline, signalling that more selling is on the way from both the retail folks and larger institutional entities.
The crucial support zone of $0.0000090 is now perilously close, and if that falls, expect a quick exodus. The suggestion of coordinated selling – bigger players offloading their holdings onto anyone who’s still paying attention – is particularly worrying. 🚨
All the major moving averages are sitting above the current price, indicating a fully formed bearish trend. The 200-day MA has been a ceiling since August, and attempts to reach it have been met with firm rejections. It’s all very reminiscent of the final stages of something coming to an end.
Volume tells a story too: every rally is accompanied by higher selling volume. Basically, people are exploiting any brief upticks to get rid of their holdings. Combine that with weak inflows and an RSI near 33, and the picture is… persistent weakness. Basically, it’s not looking good.
If the selling continues, SHIB could fall toward $0.0000080, and potentially even back to $0.0000070. Unless market sentiment takes a sudden, dramatic turn, it’s unlikely to be a pleasant few weeks.
Read More
- Brent Oil Forecast
- Silver Rate Forecast
- Gold Rate Forecast
- TRX PREDICTION. TRX cryptocurrency
- EUR AUD PREDICTION
- Crypto Carnage: Fed’s “Hawkish Cut” Leaves Bitcoin in Tatters 🎢💸
- Bitcoin: Rich People’s Casino 🤑
- USD ILS PREDICTION
- USD PEN PREDICTION
- XDC PREDICTION. XDC cryptocurrency
2025-11-05 03:26