Bitcoin is sittin’ pretty at $91,667 on Nov. 20, 2025, at 8 a.m. Eastern time, with a market capitalization of $1.82 trillion and a hefty 24-hour trading volume of $85.22 billion. It danced within a volatile intraday range between $88,540 and $92,943-enough of a swing to rattle even the steadiest hands. 🚀💸
Bitcoin Chart Outlook
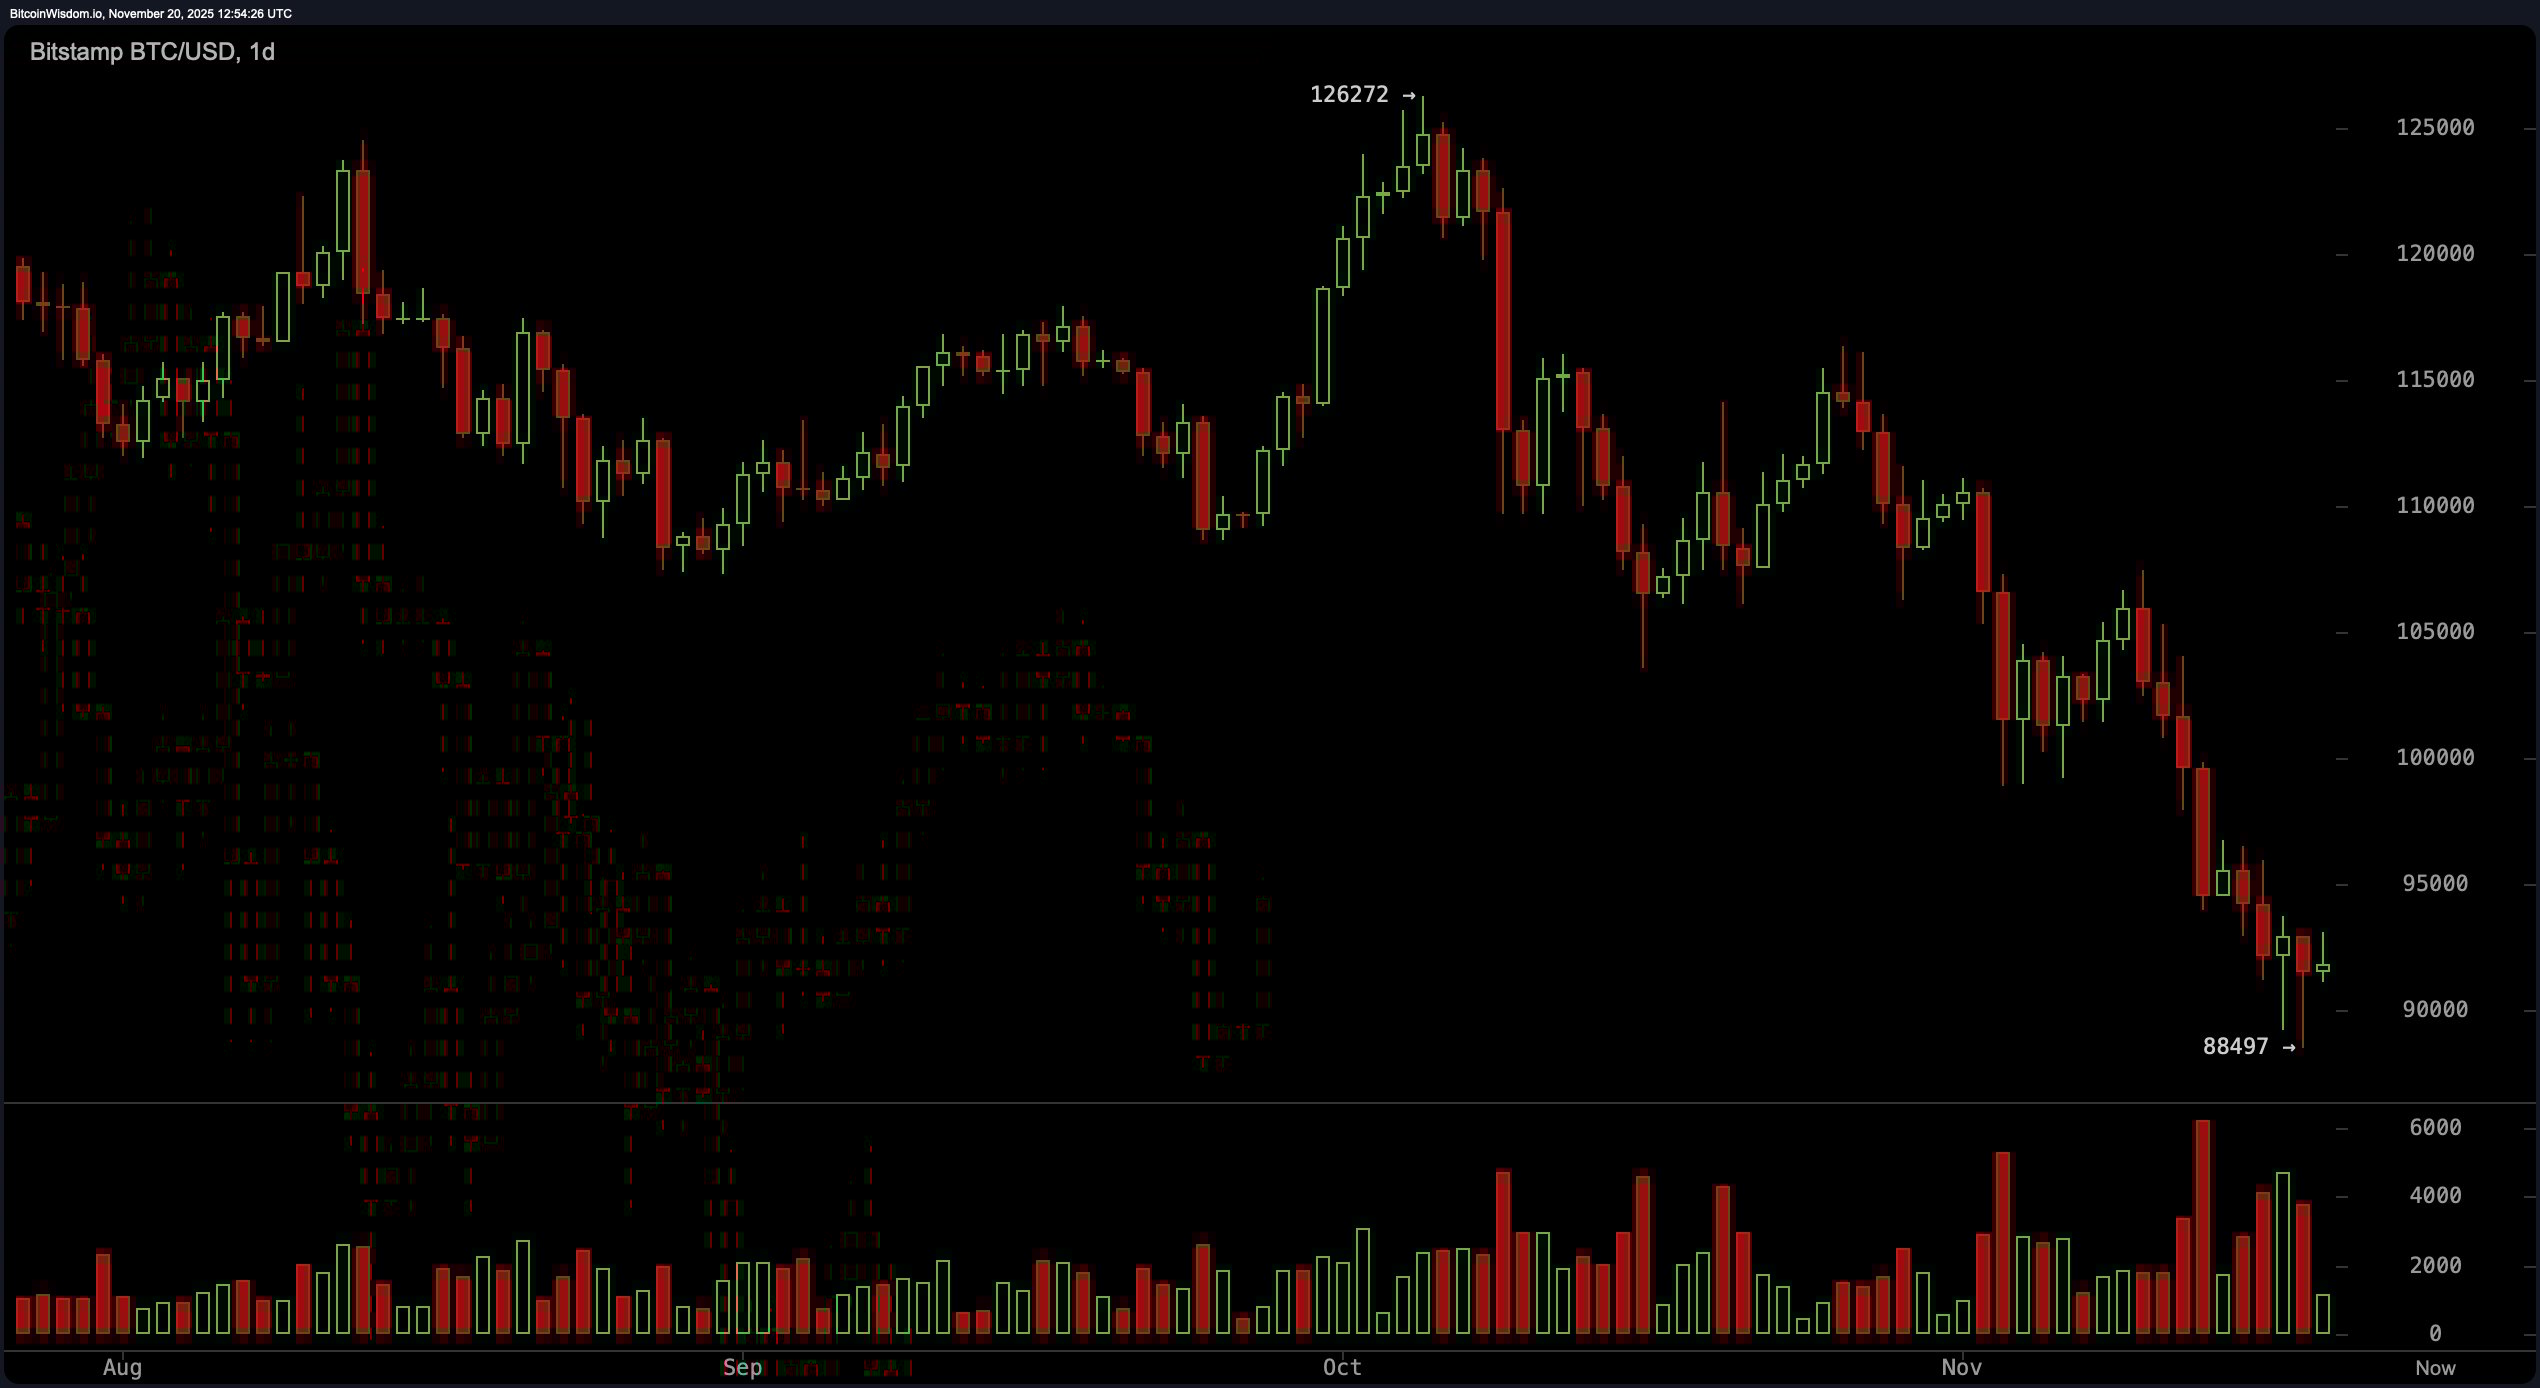
Zooming out to the daily chart, bitcoin appears to be in no rush to reclaim its former glory. Since peaking around $126,272 in early October, it has endured a relentless descent, settling near $88,497. The formation resembles a textbook descending channel, perhaps even a double top breakdown-both bearish cues for chart enthusiasts. 🧠📉
Volume spikes during sell-offs suggest that panic, not poise, has been steering this ship. Support holds precariously around the $88,000 to $90,000 zone, while resistance overhead looms large between $98,000 and $102,000. 💸
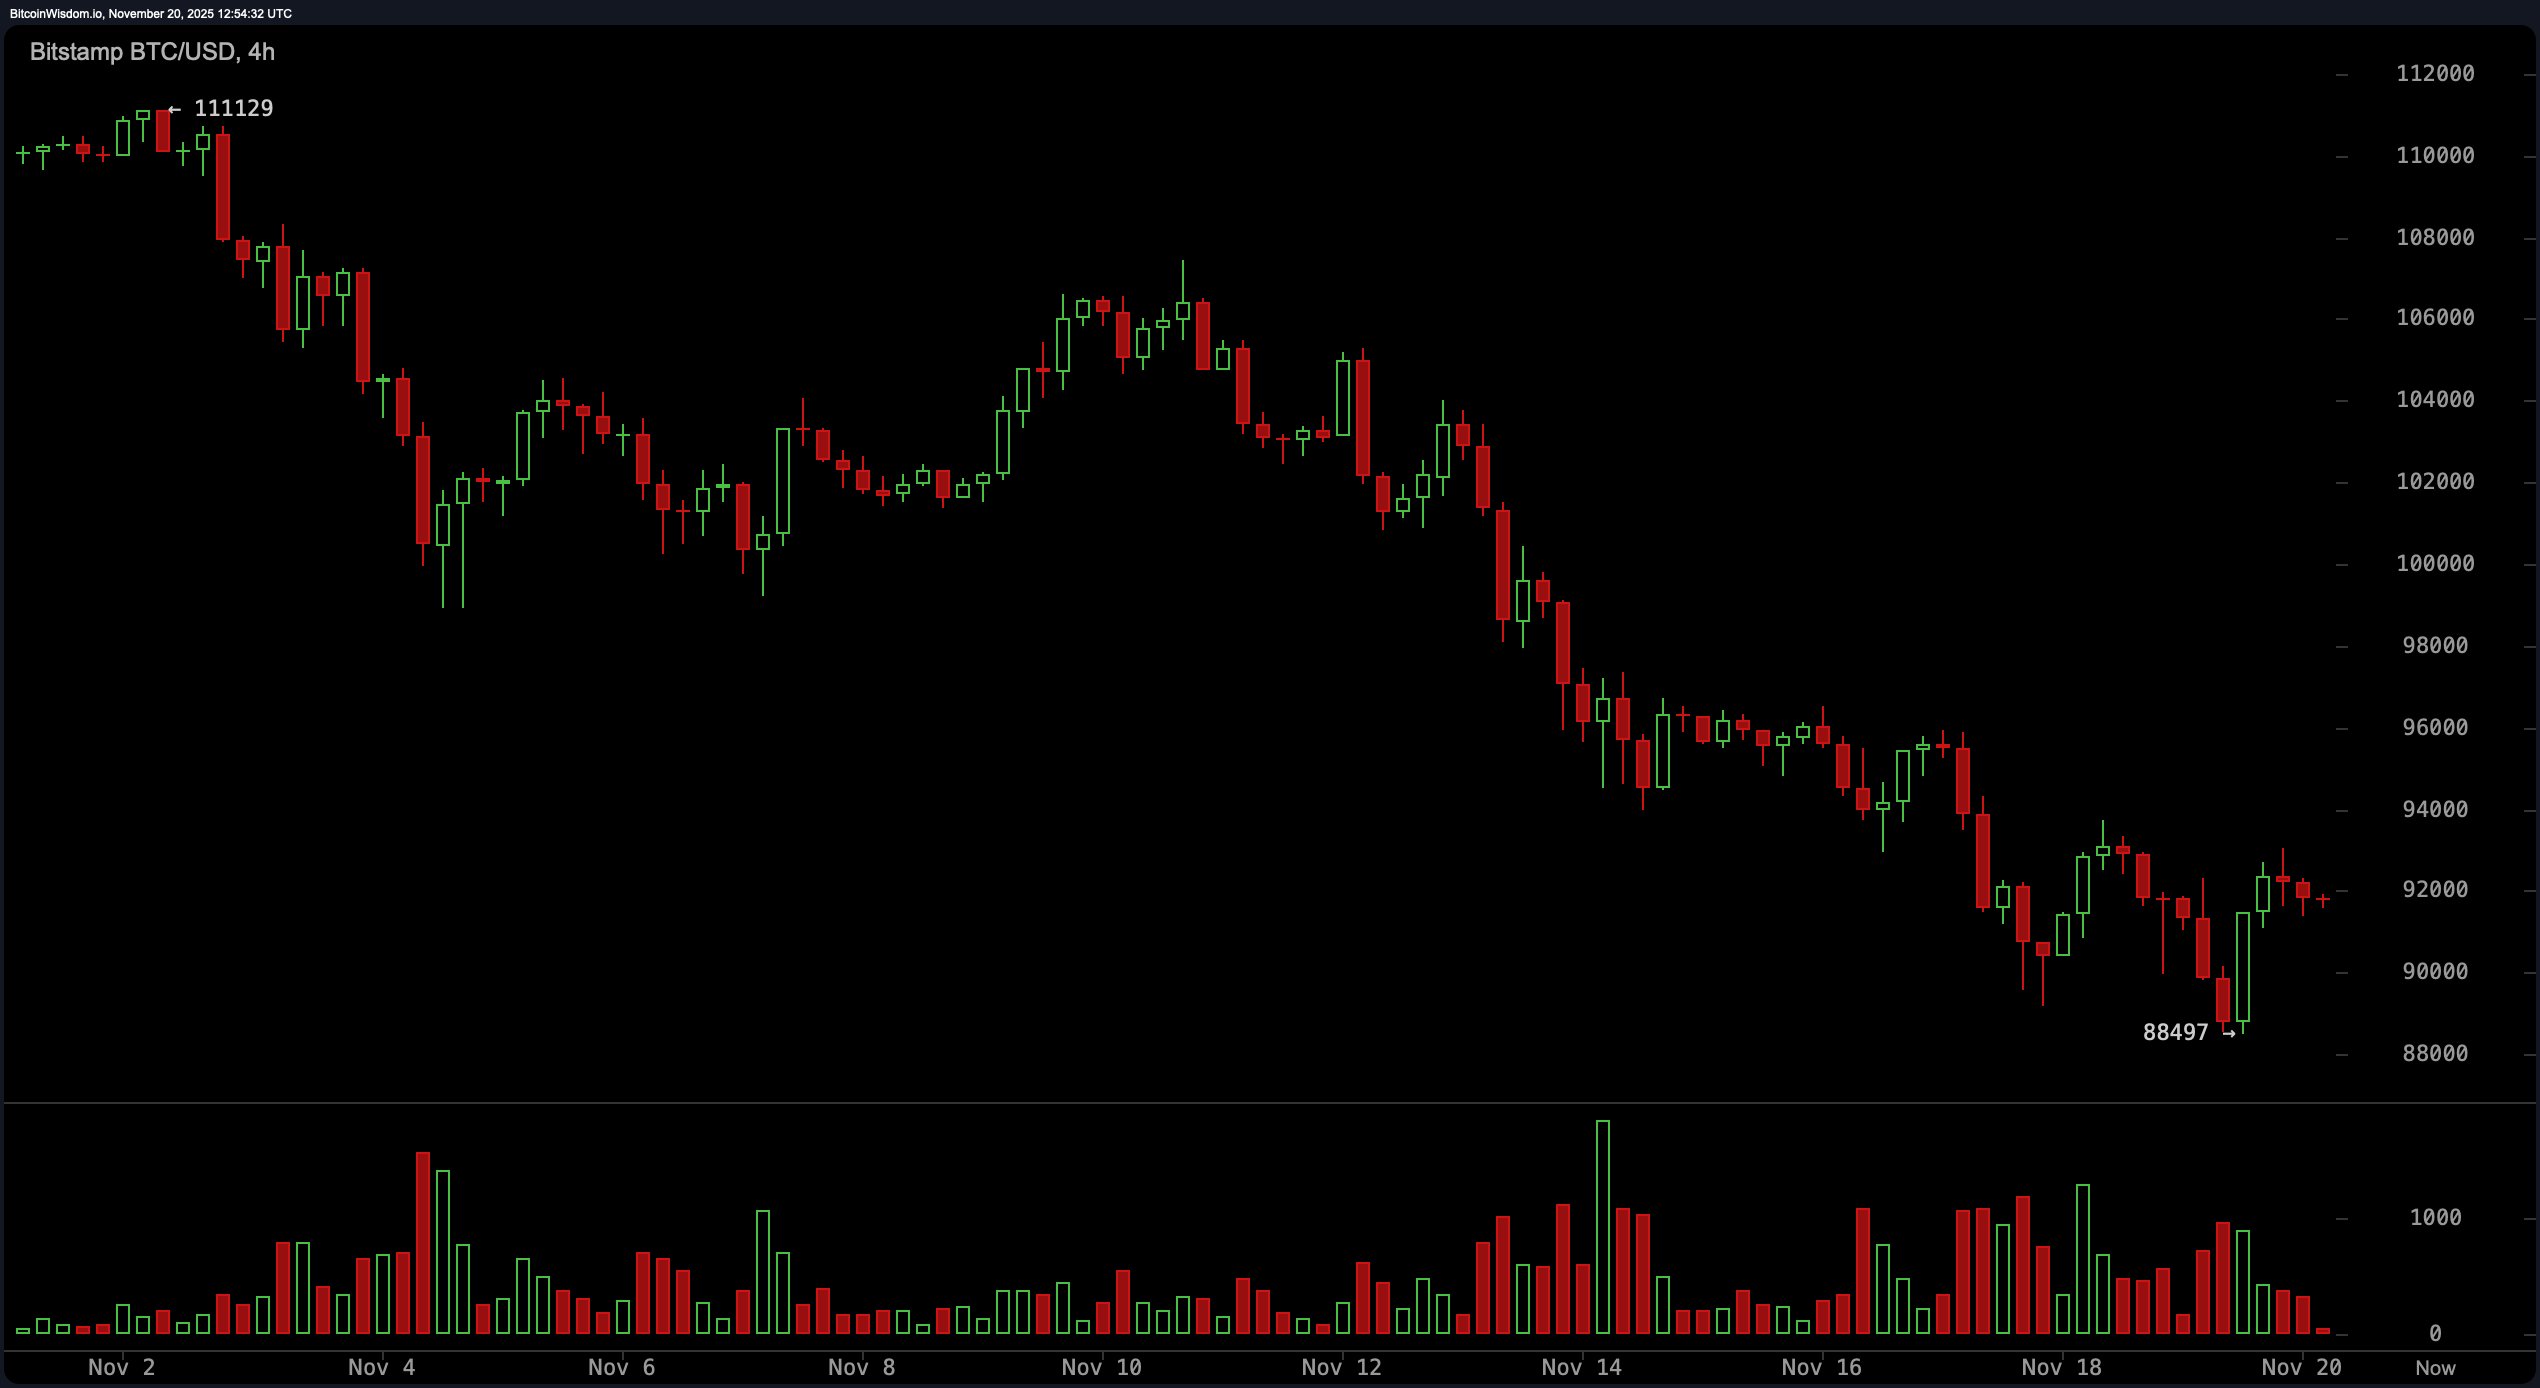
On the four-hour chart, the landscape softens slightly. While the broader trend remains bearish, momentum appears to be limping toward exhaustion. Some green volume spikes offer a glimmer of hope, hinting at possible short-covering or stealth accumulation. A rounding bottom is taking shape, and if bitcoin can close above $92,500-$93,000 with meaningful volume, that could signal a short-term reversal. But beware: the $98,000 mark still marks the threshold where many bulls lose their nerve. 🐄
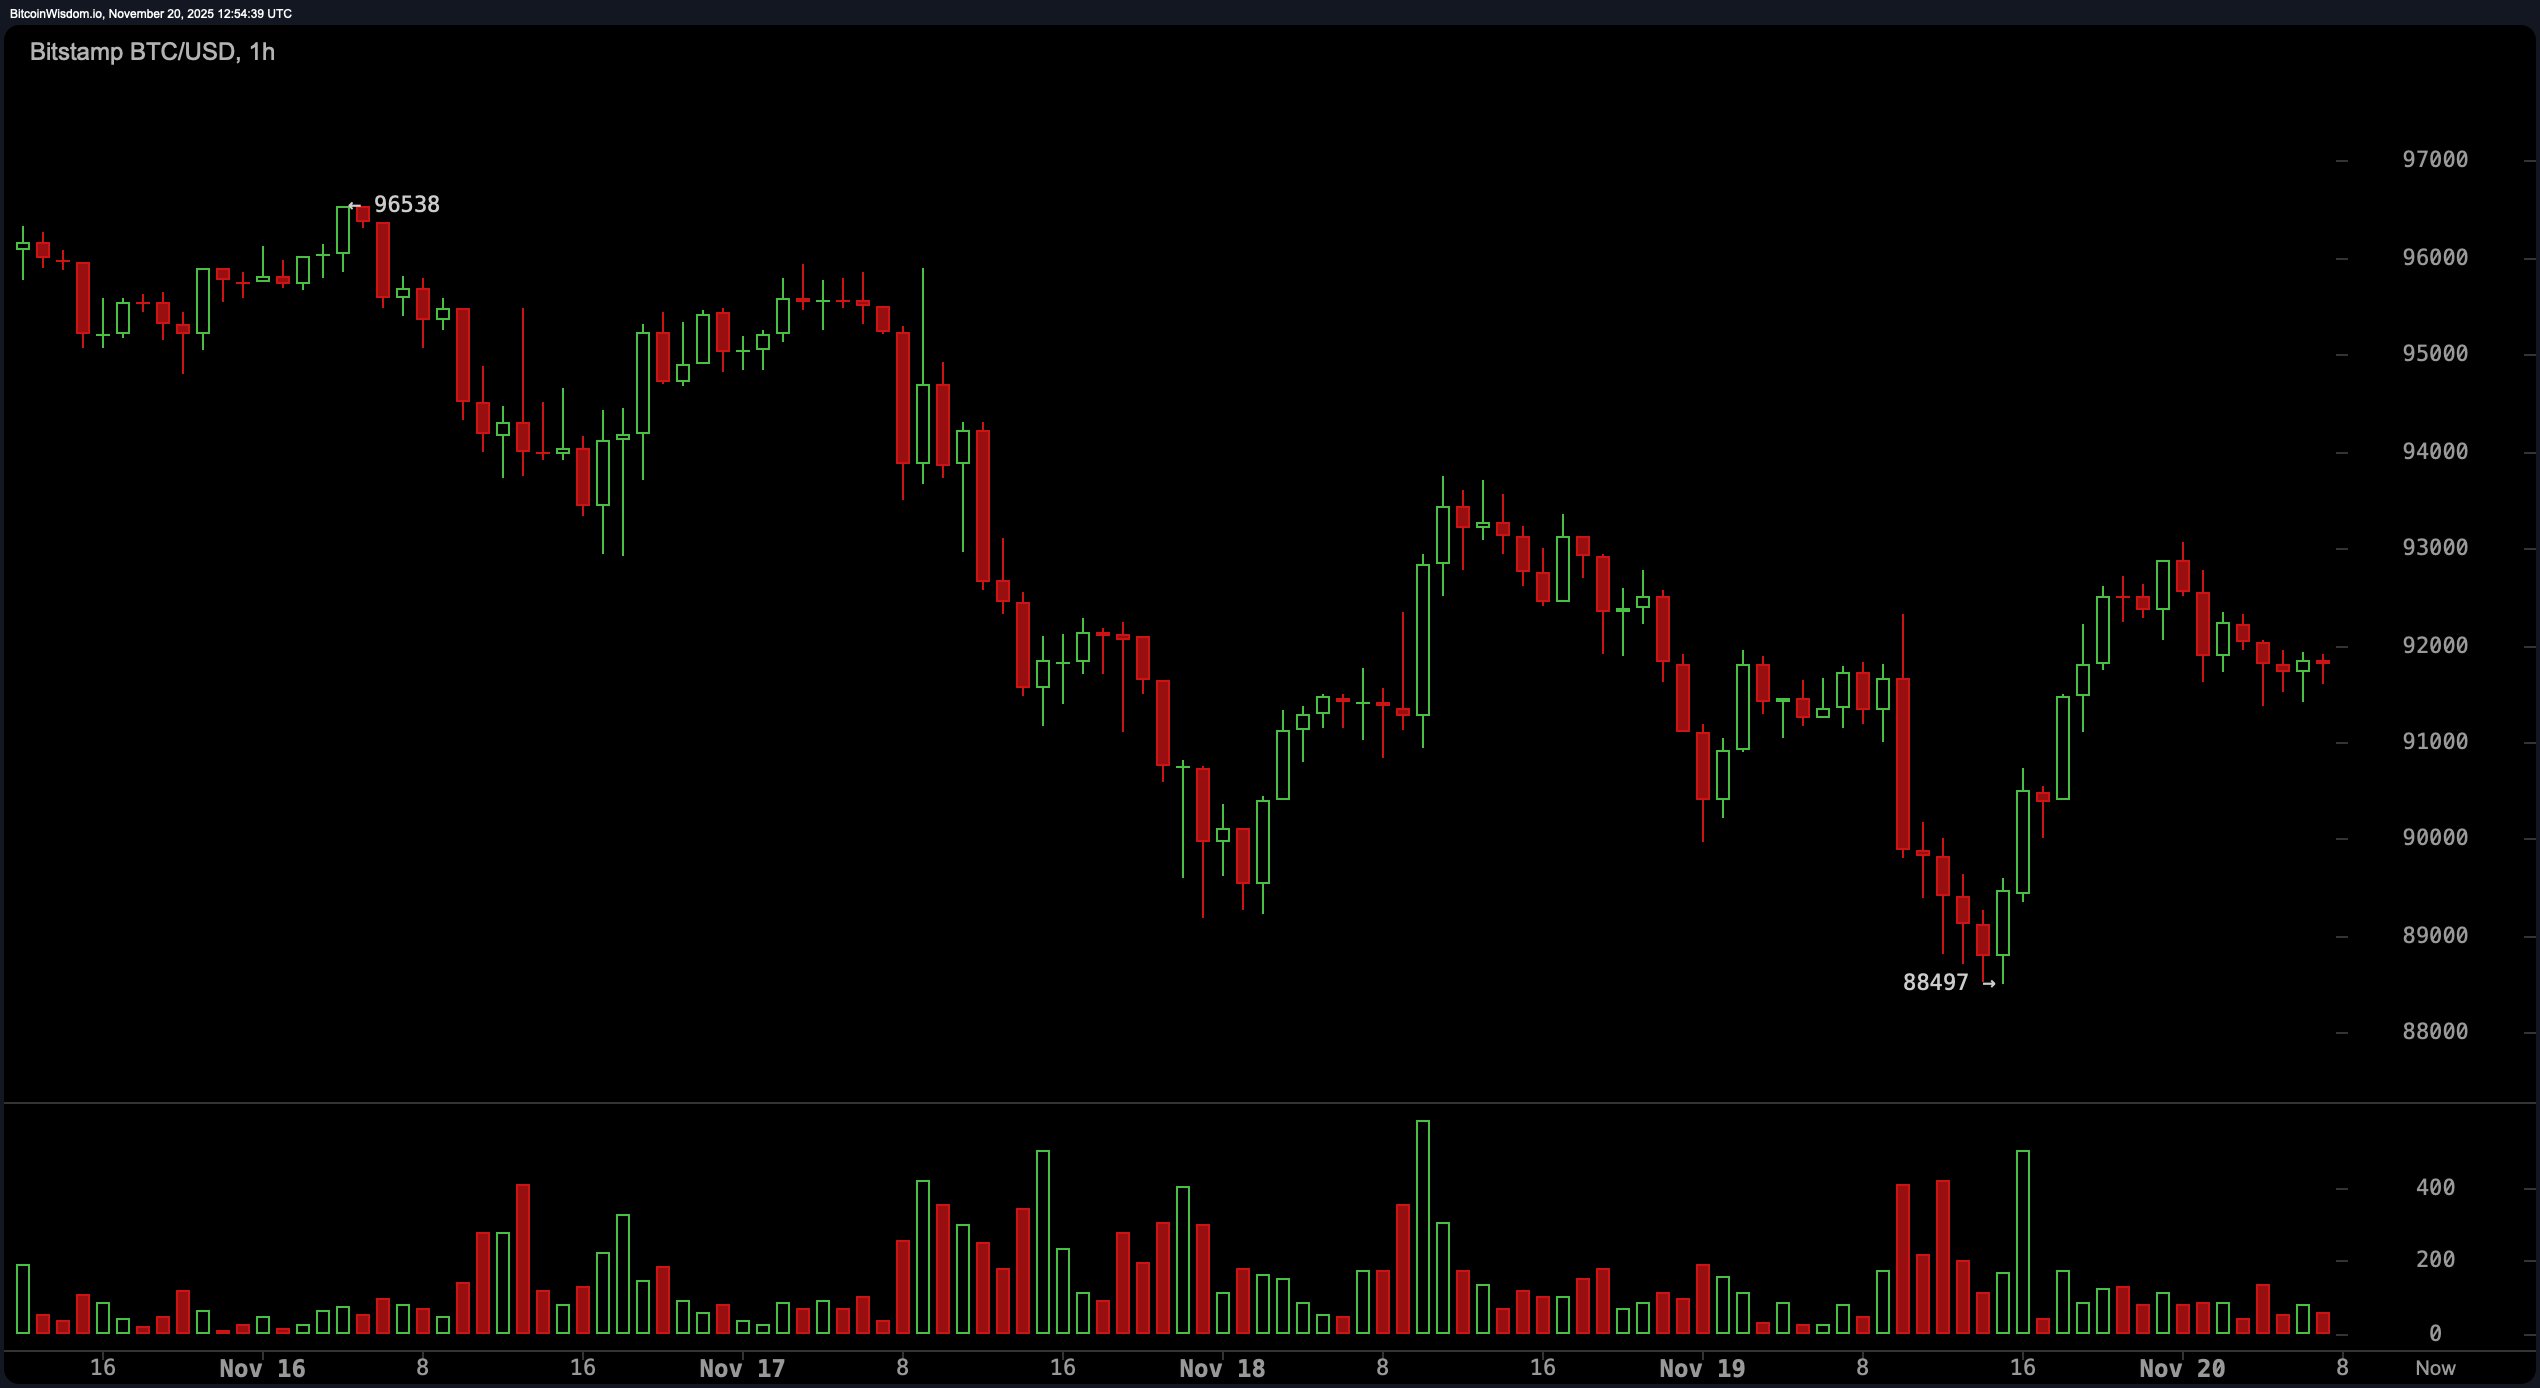
The one-hour chart is where things get interesting. A series of higher lows suggests that a local reversal attempt is underway. Green volume bars offer confirmation, and an inverse head and shoulders pattern is tiptoeing onto the scene between Nov. 18 and 20. A breakout above $92,500 would be the go-ahead for a push toward the $96,000 target-so long as traders maintain their composure and keep an eye on that $90,000 stop-loss line. 🚨
Indicators paint a picture that’s more “wait and watch” than “dive right in.” The relative strength index (RSI) sits at a neutral 30, while the Stochastic oscillator loiters at 18, also neutral. The commodity channel index (CCI) is at −115, suggesting a potential recovery, but the momentum indicator at −14,170 and moving average convergence divergence (MACD) level at −4,727 aren’t exactly throwing a party. All major moving averages-from the exponential moving average (EMA) 10 to the simple moving average (SMA) 200-are unanimously unfriendly, clocking in well above the current price and urging caution. 🧠
In sum, this is a bear market bounce in progress, not a phoenix rising just yet. Unless bitcoin mounts a convincing move above $102,000 and camps out there with strong volume, this show remains a cautiously optimistic intermission in an otherwise downward production. Watch those breakouts like a hawk-without volume, they’re just shadows on the wall. 🕵️♂️
Bull Verdict:
If bitcoin breaks above $92,500 with conviction and pushes past the $98,000 resistance zone, there’s potential for a short-term rally toward $102,000. Volume confirmation is non-negotiable-without it, any breakout is just wishful thinking dressed as momentum. 🧠
Bear Verdict:
With all major moving averages pointing down and momentum indicators like the MACD and momentum index flashing red, the prevailing trend remains bearish. A breakdown below $88,000, especially with volume backing it, could accelerate the fall and send bitcoin hunting for lower support zones. 🐍
FAQ 💡
- What is bitcoin’s current price as of Nov. 20, 2025?
bitcoin is priced at $91,667 with a 24-hour range between $88,540 and $92,943. 🚀 - Is bitcoin in a bullish or bearish trend right now?
The trend is predominantly bearish, with all major moving averages above current price levels. 📉 - Where is key support for bitcoin on the charts?
Strong support lies around the $88,000 to $90,000 range. 💸 - What could signal a short-term reversal in bitcoin?
A breakout above $92,500 with confirmed volume could indicate bullish momentum. 🚀
Read More
- Gold Rate Forecast
- Brent Oil Forecast
- Silver Rate Forecast
- Bitcoin at Halfway Through Halving: Gains Lag Behind Previous Cycles
- DOGE PREDICTION. DOGE cryptocurrency
- USD CNY PREDICTION
- USD CLP PREDICTION
- USD MYR PREDICTION
- WLD PREDICTION. WLD cryptocurrency
- USD TRY PREDICTION
2025-11-20 17:18