So, Bitcoin, huh? It’s in this corrective phase right now, like it’s trying to find itself after a mid-life crisis. Remember when it tried to break out above the mid-$90,000s? Yeah, that went well. It’s like going to a party and realizing you’re wearing the wrong outfit-everyone’s just staring at you, and all you want to do is crawl back to your couch.
Now we’re stuck in this range-bound market with a slight bearish tilt. Support levels are being tested more than your patience during a long family dinner. If we’re lucky, we’ll see a higher-low scenario; if not, get ready for a plunge-it’s like waiting for the punchline of a bad joke that never comes.
The Daily Chart: A Comedy of Errors
On the daily chart, Bitcoin got rejected from the $95,000-$97,000 resistance band. That’s right, rejected-like the last guy at the bar who thought he had a chance. The price is now slinking back to the $90,000 support area, which is like the safety net of this whole circus act.
And let’s talk about the RSI rolling over from near overbought readings. It’s moving back toward neutral territory. Come on! Can’t we just keep some bullish momentum? As long as we stay above the $88,000-$90,000 area, we can still dream. But if we slip below, well, it’s time to hold onto your hats because we might be heading down to $80,000 faster than a bad date leaves a restaurant.
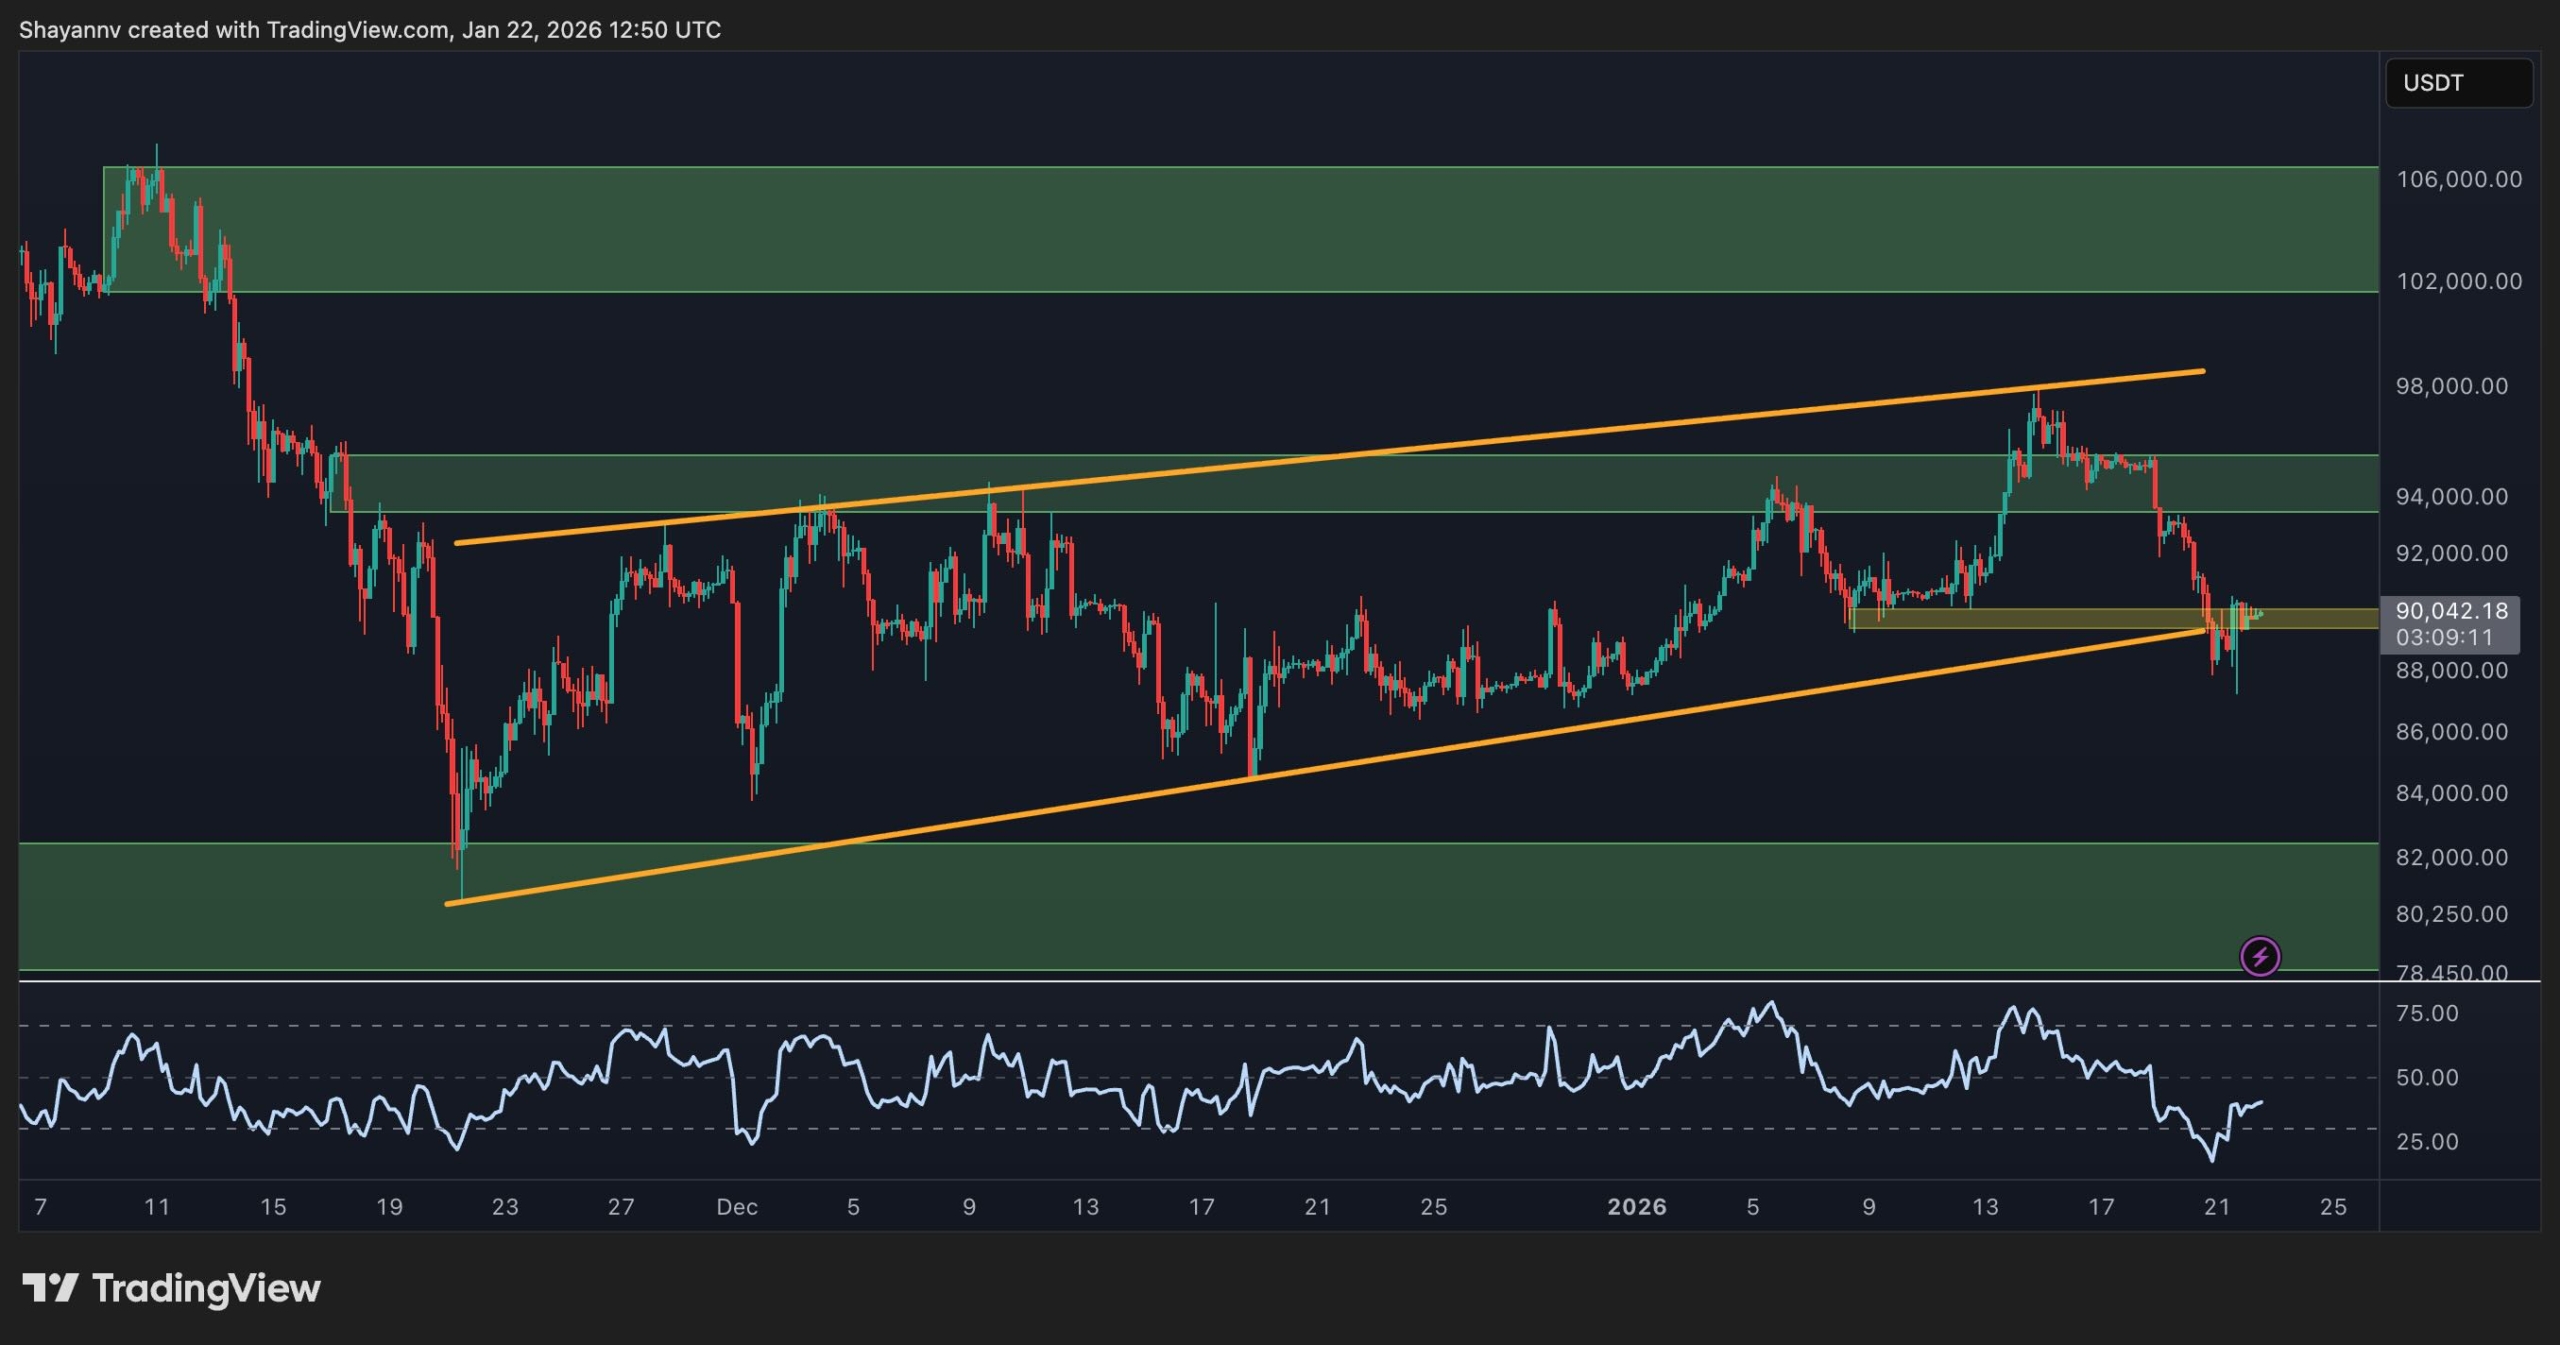
BTC/USDT 4-Hour Chart: The Ups and Downs
Looking at the 4-hour chart, it shows Bitcoin trying to break away from this upper boundary of the rising channel. It’s like watching someone attempting to jump over a puddle, but they just end up splashing everywhere. Oh, and now we’re retesting the $90,000 zone-previously a pivot area, now just a sad reminder of what could have been.
The RSI on this timeframe has recovered from oversold territory but remains subdued. It’s like a tired dog that just wants to lie down. If we can hold above $90,000, maybe we’ll see a gradual bounce back to the $95,000 mark. But repeated failures? Oh boy, that’s a red flag waving in the wind-sellers are still calling the shots, and we might just revisit that $80,000 support like an unwanted guest that keeps showing up.
On-Chain Analysis: The Party’s Over
Now, let’s get into the on-chain data. Active addresses are dropping like flies. The 30-day EMA of Bitcoin active addresses is on a steady decline since early 2025. This isn’t just a trend; it’s practically a funeral procession while the price hovers around $90,000, looking all lonely and lost.
This negative divergence suggests the recent price resilience is more of a mirage, driven by existing participants rather than a fresh wave of buyers. It’s like a party where only the same few people keep showing up, while everyone else has moved on. Until we see some new faces, let’s keep our wallets close and watch those support/resistance levels because this isn’t the time for reckless spending.

Read More
- Bitcoin at Halfway Through Halving: Gains Lag Behind Previous Cycles
- WLD PREDICTION. WLD cryptocurrency
- Silver Rate Forecast
- DOGE PREDICTION. DOGE cryptocurrency
- Gold Rate Forecast
- Brent Oil Forecast
- Ethereum Reserves Dry Up as Whales Buy – Is a Supply Crunch on the Way?
- USD CLP PREDICTION
- Bitwise Solana ETF Soars on First Day: What You Need to Know!
- Russia’s Crypto Revolution: Can Anyone Buy a Bitcoin Now? 🤑💸
2026-01-22 18:42