Solana tiptoes under the $100 line for the first time in ten months, and the market feels like someone forgot to feed the chorus before curtain call. Is there a rescue mission in sight, or are we just watching the drama unfurl?
SOL is down nearly 20% over the last week and around 25% over the last 30 days.
With prices sliding, market activity isn’t exactly throwing a party either. Solana’s 24‑hour volume fell 26% to $7.63 billion, suggesting the weekend sell‑off might be winding down. Derivatives aren’t throwing a party either.
CoinGlass shows total volume down 21% to $19.26 billion, with open interest down 5% at $6.15 billion, implying long positions are being unwound rather than new shorts barging in with fanfare.
Macro mood vs. fundamentals
The broader crypto scene is feeling the squeeze. Over the weekend, a wave of liquidations swept through the market as highly leveraged bets were purged in a liquidity-starved moment.
Meanwhile, tighter U.S. policy vibes resurfaced after President Trump nominated former Federal Reserve governor Kevin Warsh as the next Fed chair, a pick widely read as hawkish by people who can read headlines as a sport.
Geopolitical jitters add to the risk-off mood. Reports of rising U.S.-Iran tensions have nudged investors toward safer assets, with crypto once again slipping into the wings of uncertainty.
That said, Solana’s network data still looks sturdy. crypto.news reported on Feb. 1 that the network processed over 2.34 billion transactions in January, up 33% and more than Ethereum, Base, and BNB Chain combined.
While Bitcoin and Ethereum products saw net outflows in January, U.S. spot Solana ETFs recorded $104 million in inflows, suggesting that traditional investors are taking a closer look, possibly with a wary smile.
Solana price technical analysis
On the daily chart, the vibe remains bearish. The move below $100 is a psychological blow and a structural one, reinforcing the downtrend rather than derailing it.
SOL keeps making lower highs and lower lows, trading well below its declining 20‑day and 50‑day moving averages. Recent rallies stall near the mid‑Bollinger Band, indicating sellers still hold the pen even during tiny upticks.
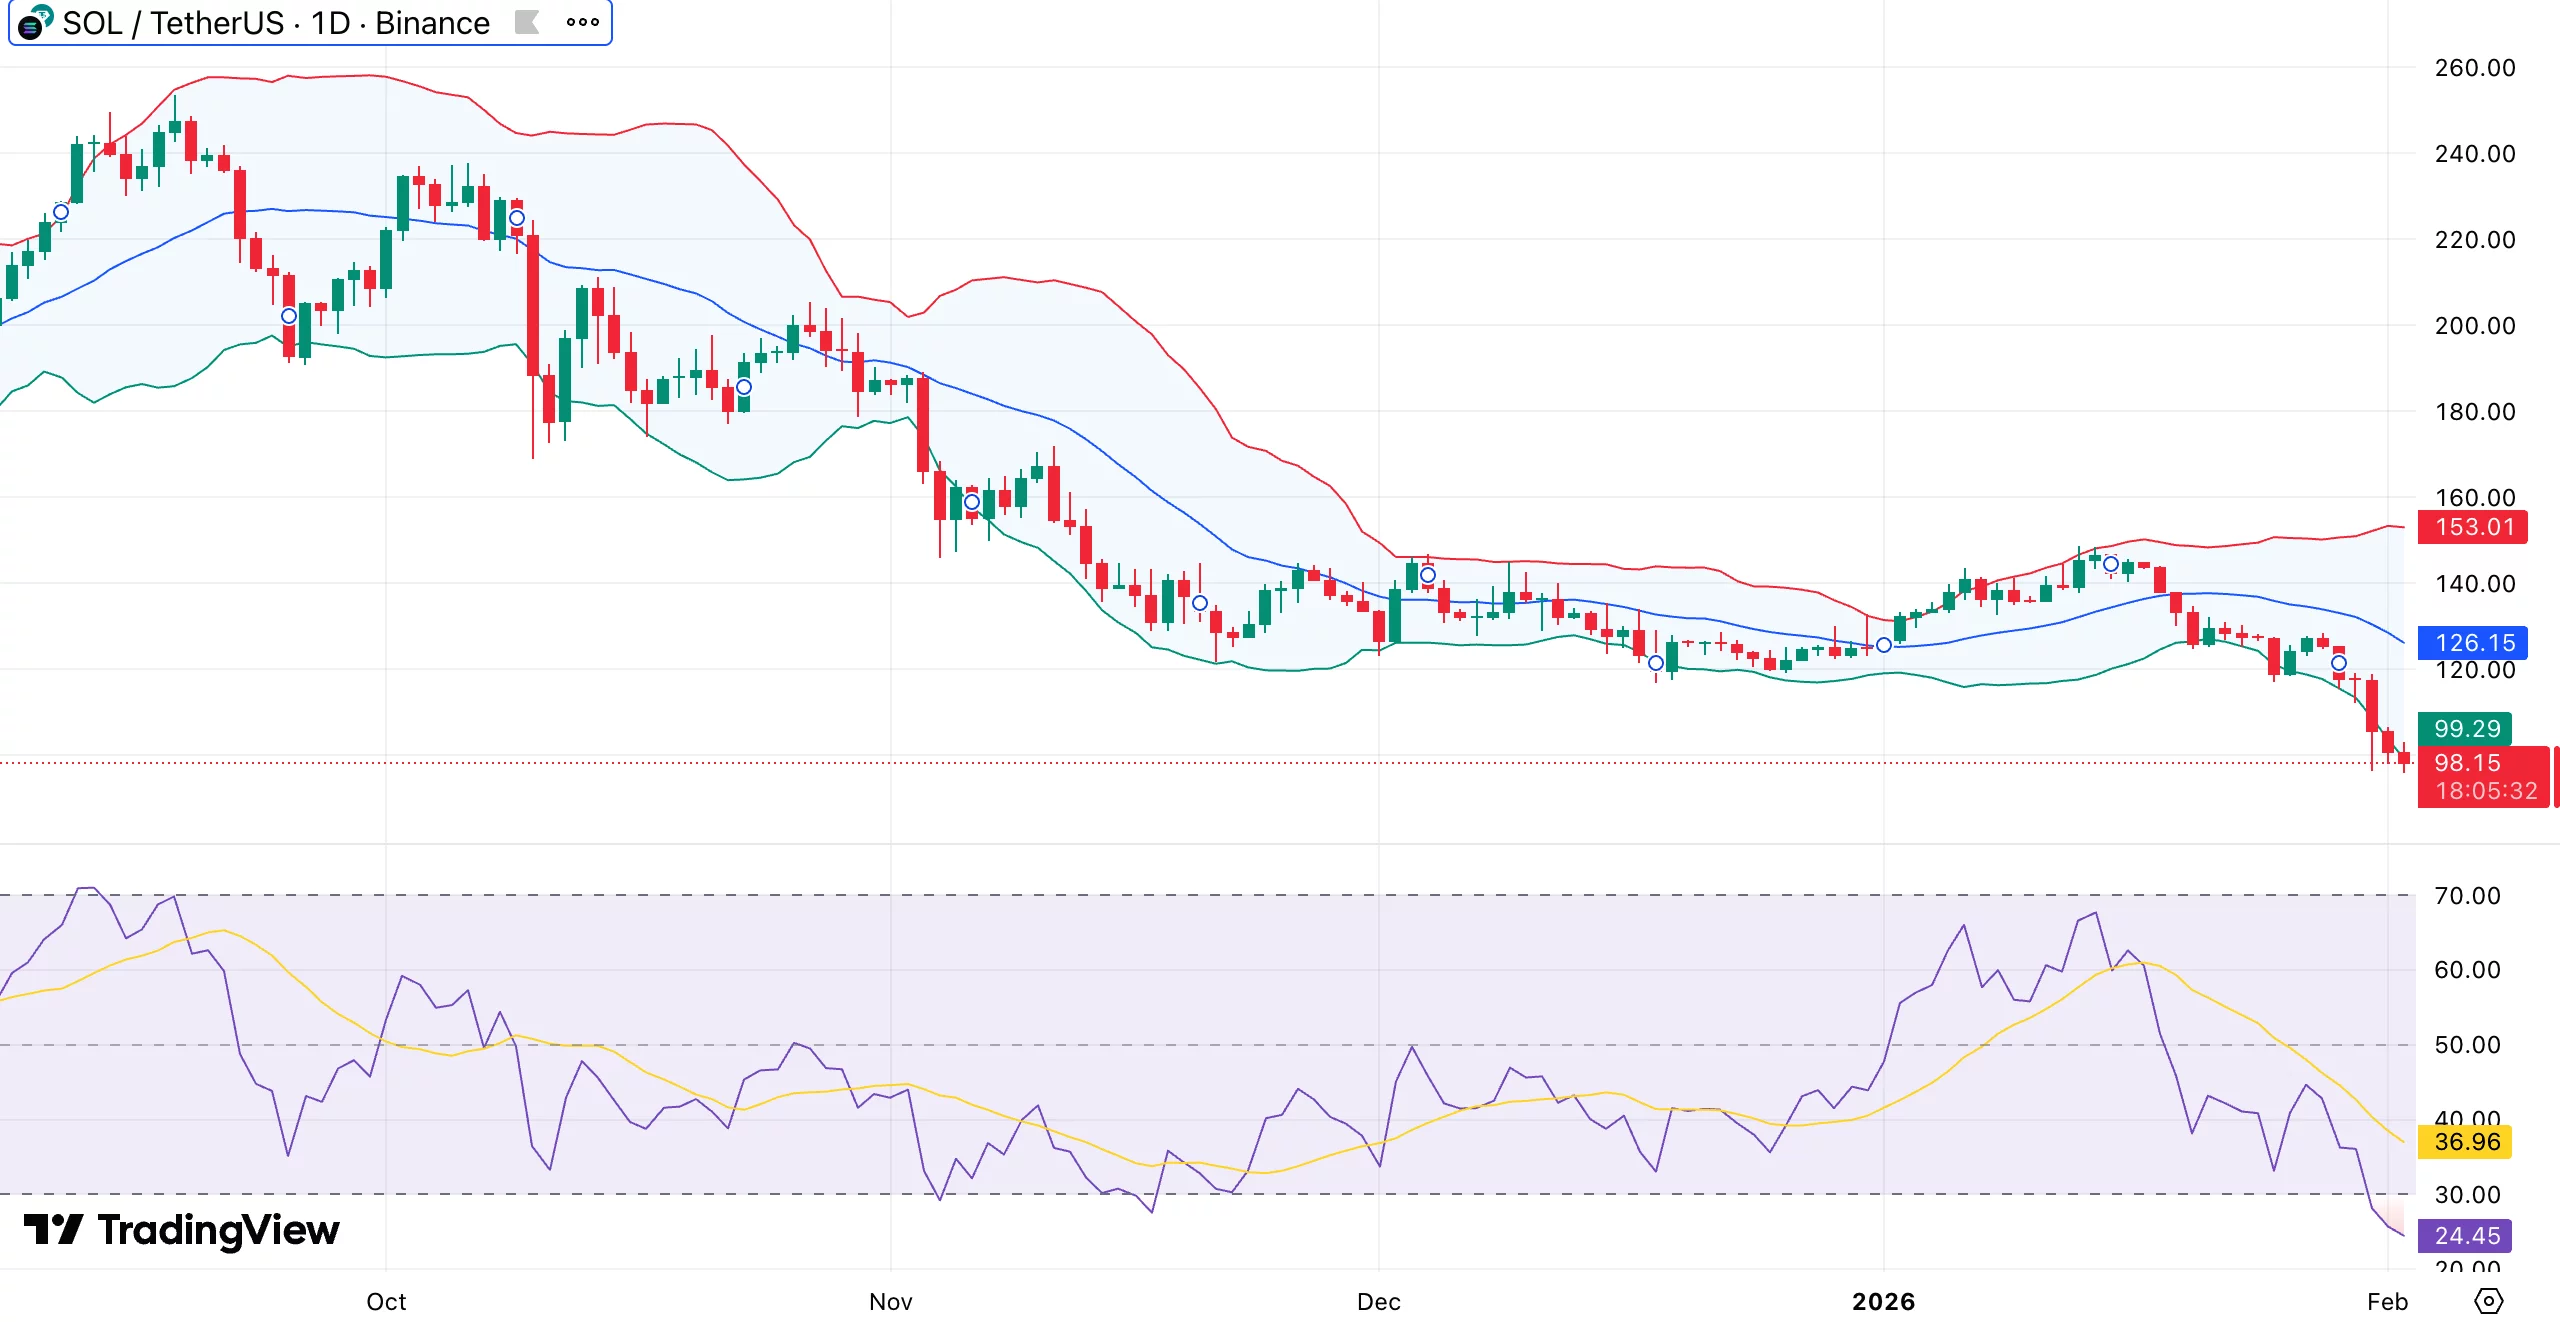
The Bollinger Bands are widening, with price hugging the lower band, suggesting downward momentum is gaining more steam than cooling off. Momentum indicators are stretched thin, too.
The daily RSI sits around 25, burying SOL deep in oversold territory. A short‑term bounce is possible, but it doesn’t automatically signal a trend reversal.
On the downside, the next zones to watch sit around $92-90, then $85, which previously acted as a consolidation zone. If selling persists, $80 looms as a higher macro support level.
For the bulls to claw back control, SOL would need to reclaim $100 and stay above the short‑term moving averages. Until then, any upward moves will likely be seen as a pause in a bearish rhythm rather than a real pivot.
Read More
- Bitcoin at Halfway Through Halving: Gains Lag Behind Previous Cycles
- Silver Rate Forecast
- USD CLP PREDICTION
- WLD PREDICTION. WLD cryptocurrency
- JPY KRW PREDICTION
- XRP Holders Beware: EarnXRP’s Hidden Fees and Risks Exposed by Analyst
- SOL PREDICTION. SOL cryptocurrency
- Bitcoin’s Back in Vogue: Are Bigwigs Saving Crypto’s Bacon?
- Aave Pause and the KelpDAO Fallout: A DeFi Lament
- Zcash Foundation Moves Fast With Zebra Patch to Secure Network
2026-02-02 10:47