Well, well, well! If it isn’t our old friend Bitcoin, tiptoeing around the $67,000 mark like it’s a delicate porcelain figurine at a bull in a china shop convention. After a fabulous three-day inflow streak of US-listed spot Bitcoin ETFs, it seems they’ve decided to take a little vacation, flipping back to net outflows. Because why not add a sprinkle of chaos to an already shaky market?
- Currently, Bitcoin is playing coy near $67,000 after those pesky ETFs turned off the money tap, prompting investors to clutch their wallets just a bit tighter.
- The ETF flow data is about as encouraging as a soggy sandwich, indicating that institutional demand is waning, which does wonders for the market’s overall stability-or lack thereof.
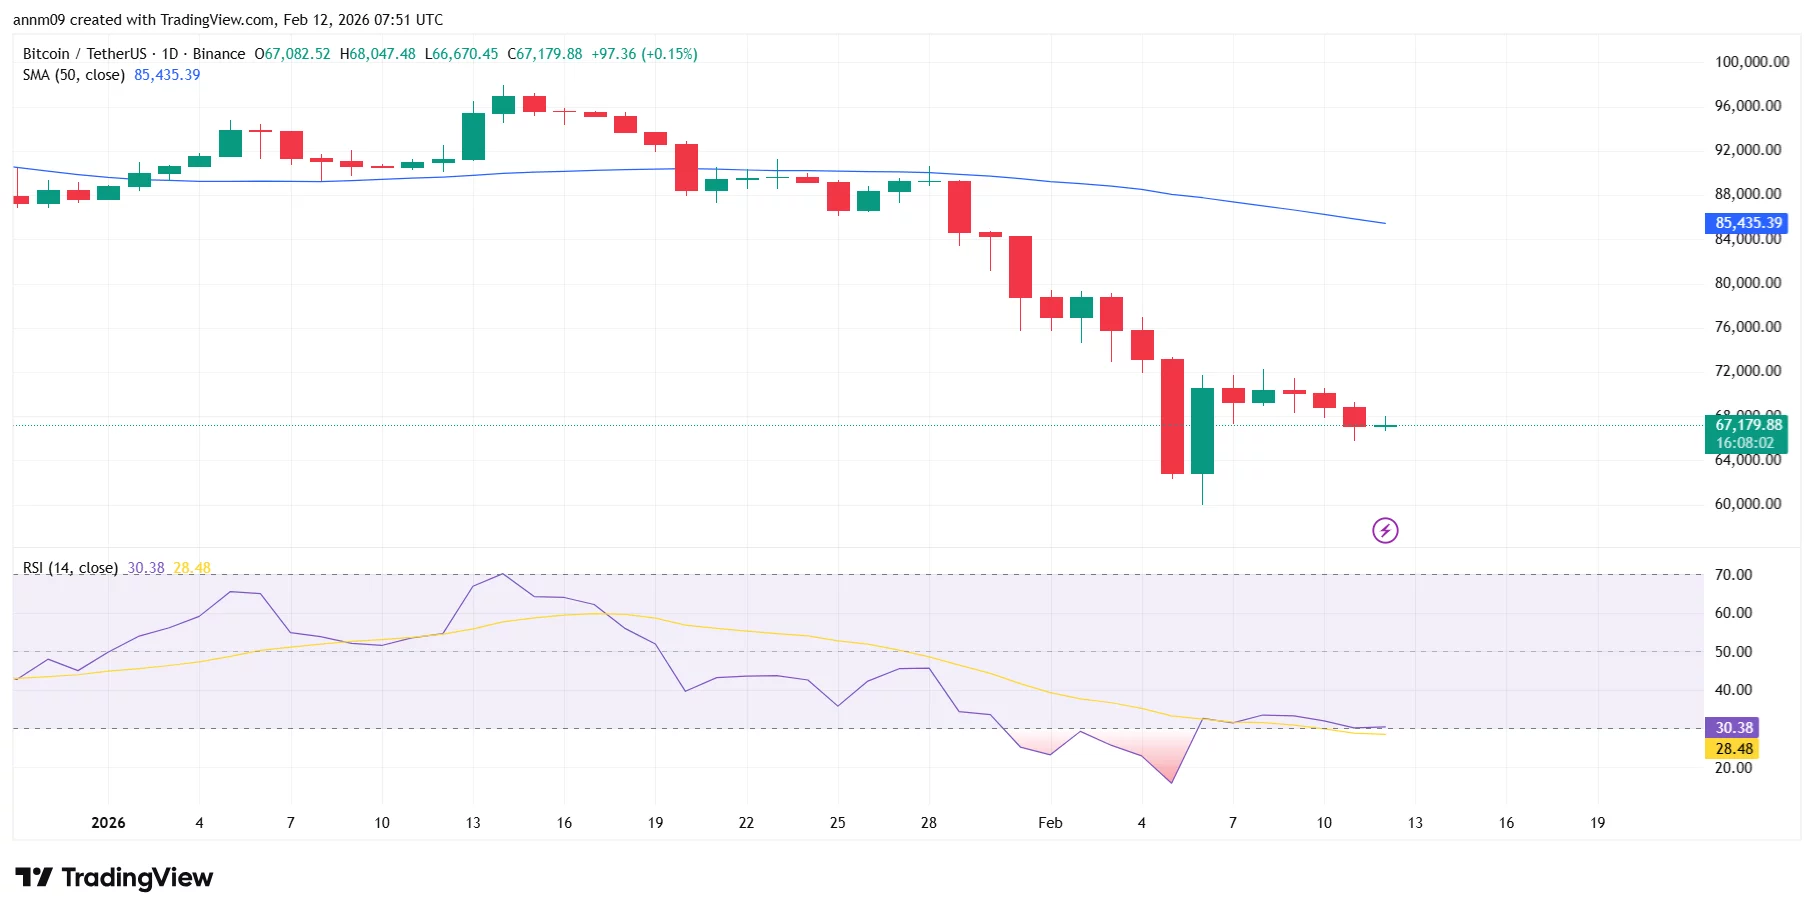
- On the technical side, BTC is still sulking beneath its 50-day moving average, while the RSI lingers in the low-30s, suggesting that any momentum is decidedly tilted toward a downward spiral.
Bitcoin Price Struggles as ETF Momentum Stalls
As we check in on our favorite cryptocurrency, Bitcoin (BTC) is still trying to make a name for itself at about $67,000, but strong upside follow-through seems to be as elusive as a unicorn at a tax seminar.
Those ETF flows had shown some promise, with Bitcoin spot ETFs enjoying a brief period of institutional interest, akin to a celebrity sighting in a small town. But alas, that romance was short-lived, and net outflows have returned, leaving investors feeling a tad jittery.
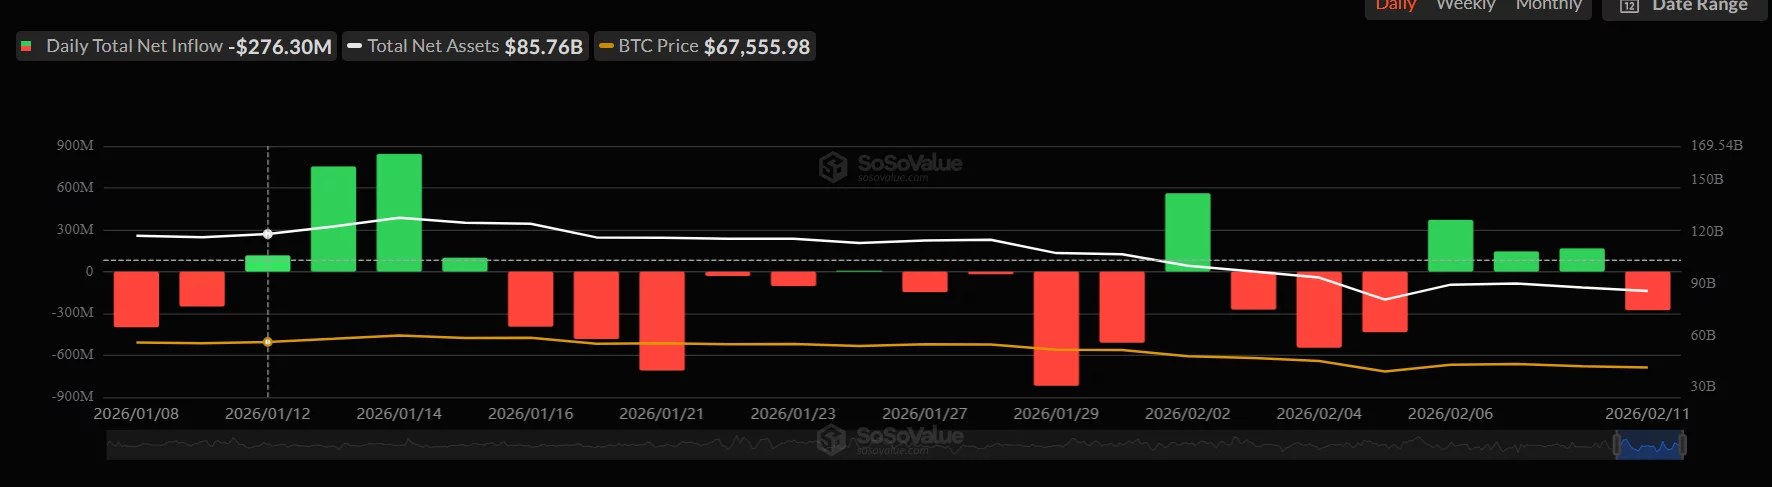
The sudden stop in ETF inflows arrives amidst a mixed bag of broader risk sentiment, as traders squint at the horizon, hoping for signs of institutional demand to re-emerge after weeks of wild price swings. Fingers crossed!
Bitcoin Price Action Weak Below Key Moving Average
Glancing at the daily chart, one can’t help but notice that Bitcoin is playing a game of limbo beneath its 50-day simple moving average, which is currently lounging around $85,000-an impressive altitude for a cryptocurrency currently in a bit of a pickle.
Meanwhile, the Relative Strength Index (RSI) is sulking below the neutral 50 level, hanging out in the low-30s and suggesting that bearish momentum is still very much the life of the party, despite a slight easing of selling pressure since January’s dramatic plunge.
If we peer into the future, immediate support huddles around $66,500-$66,000, where buyers have been spotted several times recently, like moths drawn to a flickering light. However, a decisive break below this cozy zone could open the floodgates to deeper losses, possibly plunging us towards $64,000, and then, heaven forbid, the psychological horror of $60,000.
On the brighter side (if you squint hard enough), initial resistance appears around $70,000, where previous rebound efforts have met their match. Beyond that, stronger resistance lurks near $74,000-$75,000, a former support area that now looks suspiciously like a brick wall for would-be buyers.
To turn this ship around, a sustained move over these levels is essential to hint at a potential shift in the near-term momentum. But until then, Bitcoin seems content in its little consolidation phase following a sharp correction, with ETF flow data and the general market mood likely holding the key to whether BTC will soar high or plummet further in the coming days.
Read More
- Brent Oil Forecast
- Gold Rate Forecast
- Silver Rate Forecast
- Trump’s Oil Fantasy: Seize, Profit, and Declare Victory in the Straits of Hormuz
- USD CNY PREDICTION
- USD TRY PREDICTION
- Solana\’s Slump: Will Traders Wait Forever for a Catalyst?”‘, ‘reasoning_content’: None, ‘name’: None, ‘tool_calls’: None}, ‘finish_reason’: ‘stop’, ‘logprobs’: None}], ‘usage’: {‘prompt_tokens’: 733, ‘total_tokens’: 750, ‘completion_tokens’: 17, ‘estimate
- DOGE PREDICTION. DOGE cryptocurrency
- ATOM PREDICTION. ATOM cryptocurrency
- HYPE PREDICTION. HYPE cryptocurrency
2026-02-12 12:13