The price of Zcash (ZEC) jumped 23% after a key technical indicator signaled a likely price increase. The price reached almost exactly the predicted target level after breaking out of this pattern.
Zcash’s price has seen its biggest jump since early February, accompanied by the highest trading volume in two months. However, a significant increase in open interest – up 61% – combined with negative funding rates suggests many traders are betting the price will fall. The future price of Zcash in April will likely depend on whether large investors who are optimistic about Zcash, or those betting against it, prove to be right.
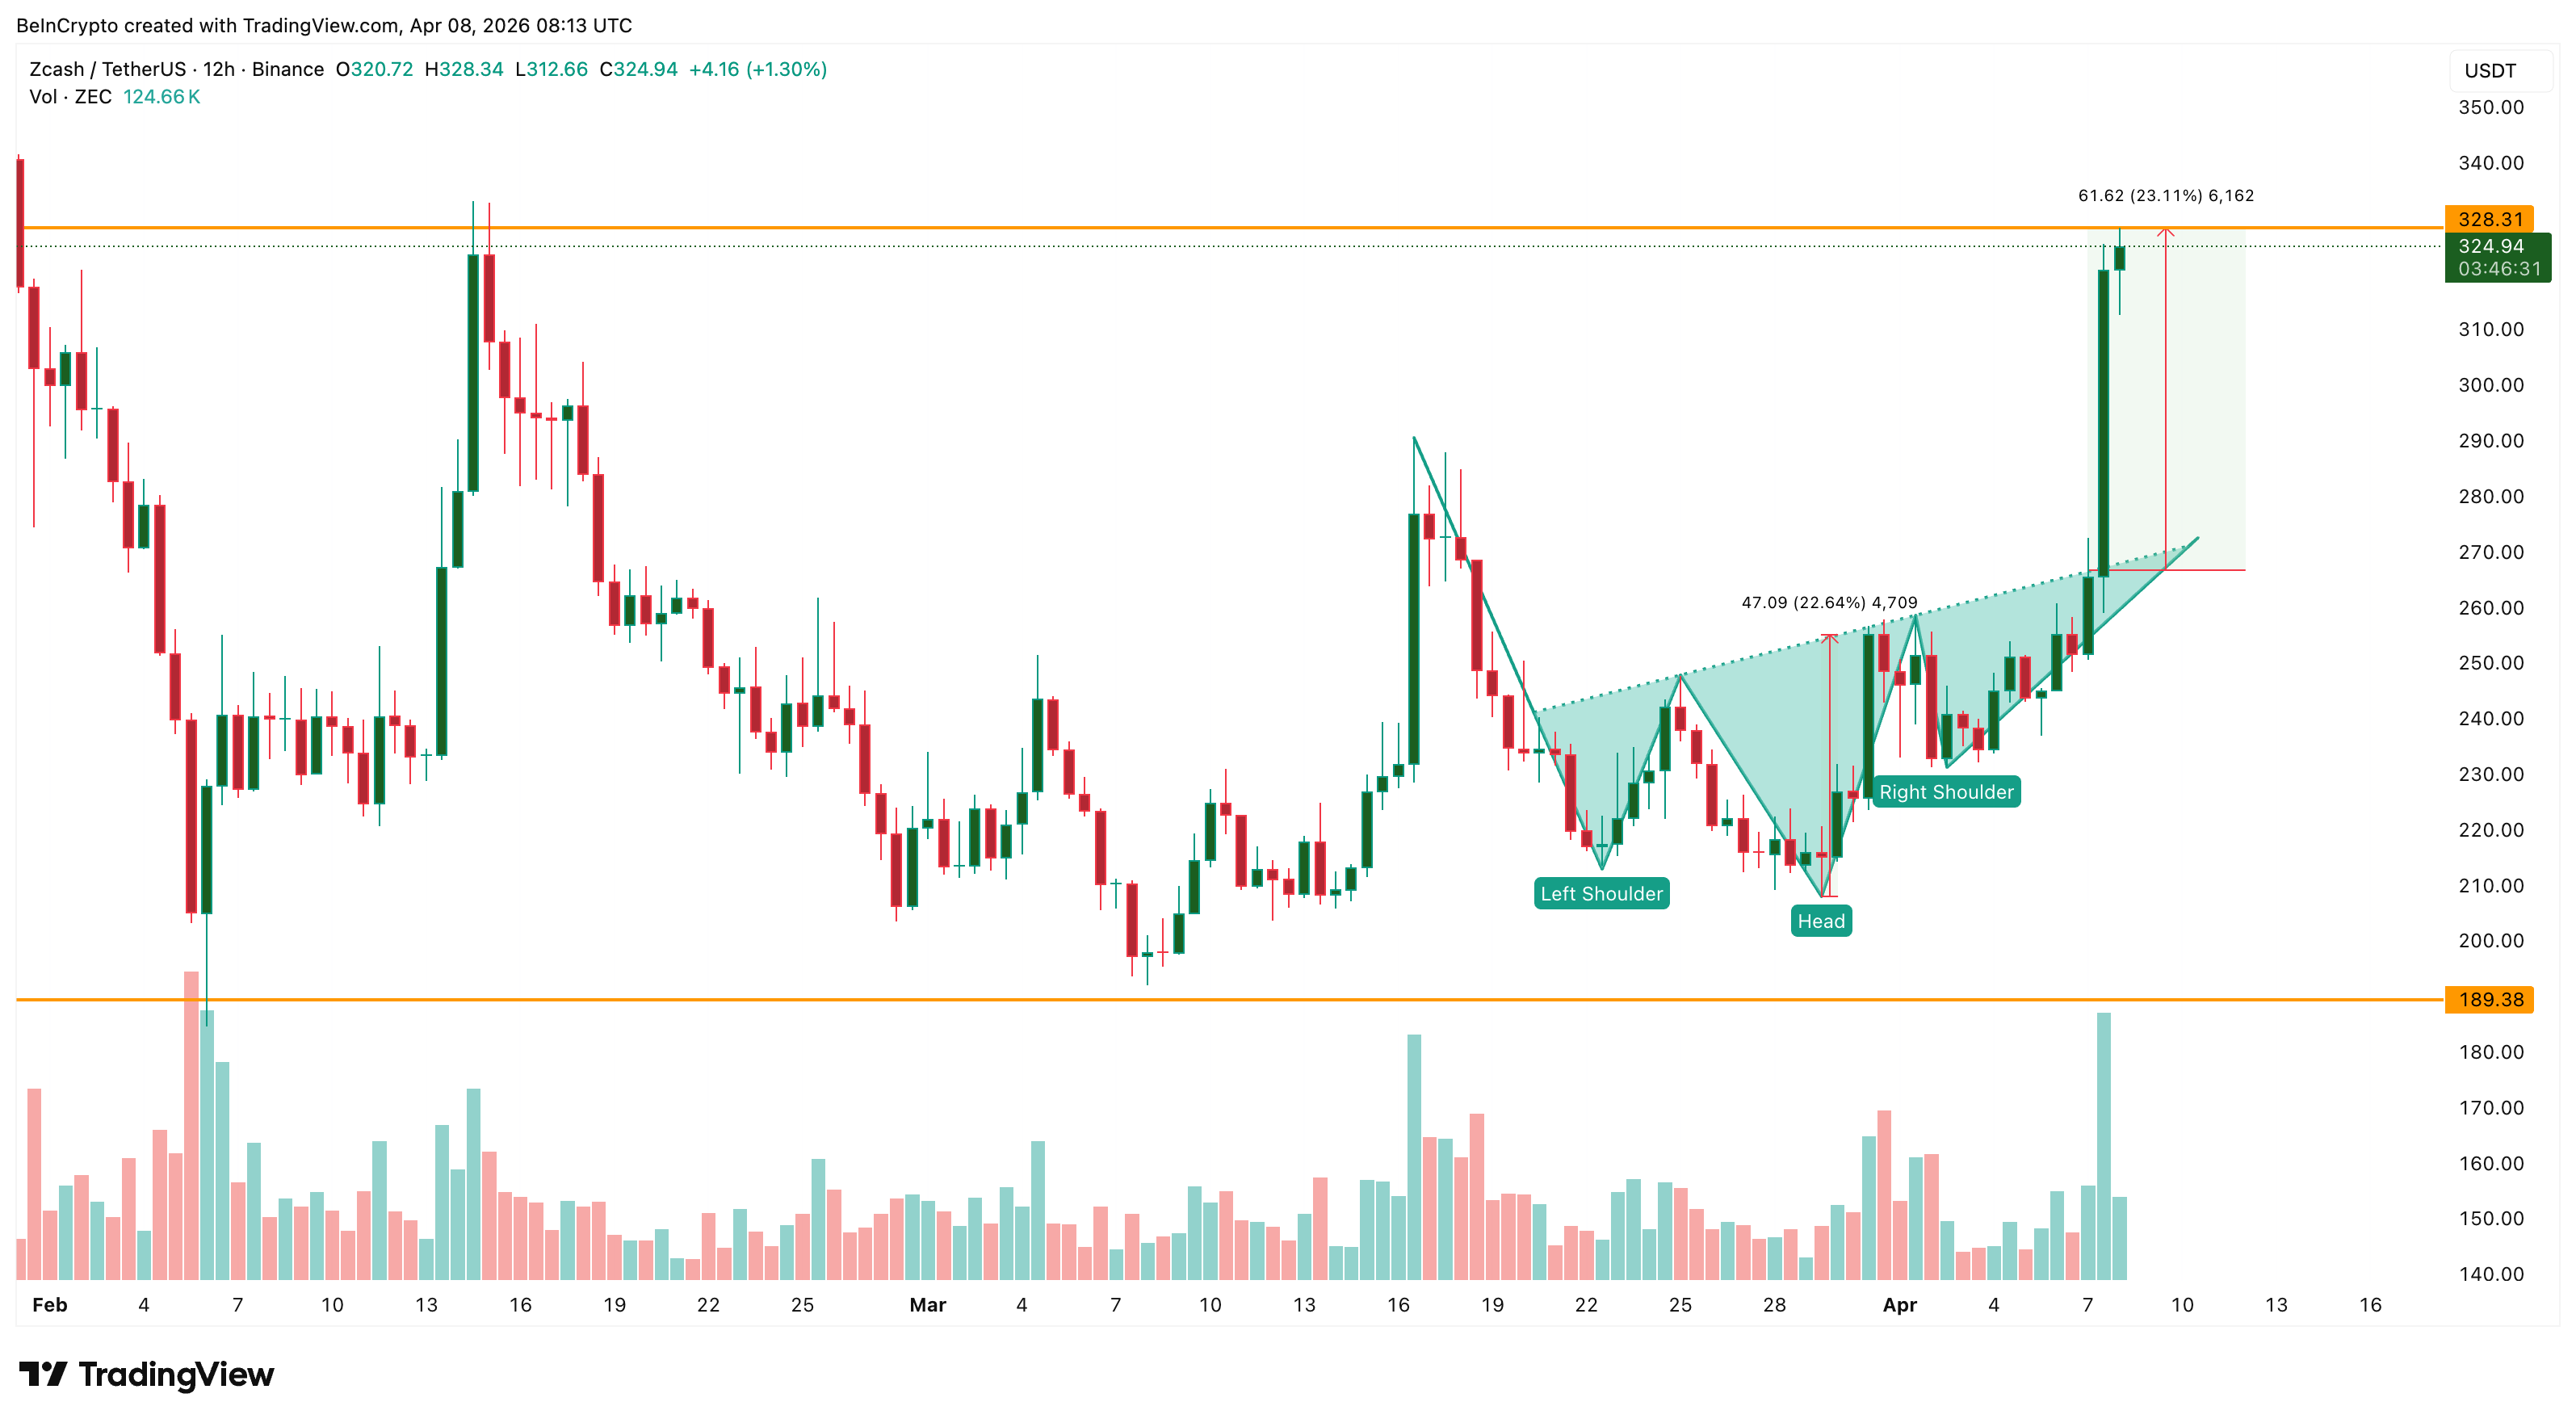
Breakout Hits 23% Target on Highest Volume Since February
On April 7th, Zcash’s price showed a bullish signal, breaking out of a specific chart pattern called an inverse head and shoulders. This breakout caused the price to increase by over 23%, reaching nearly the predicted target based on the pattern.
The recent price increase is significant because it happened with high trading volume – the highest since February. This shows strong buyer interest, not just a temporary fluctuation. After a difficult start to 2026 that caused ZEC’s value to fall by 36%, this breakout is reminiscent of the positive performance seen in 2025.
Interested in more crypto analysis? Subscribe to Editor Harsh Notariya’s daily newsletter here.
The market has reached its expected target. Now, the focus isn’t on *if* the recent surge was genuine, but rather if it will continue. Understanding who’s buying and selling may hold the key to answering that question.
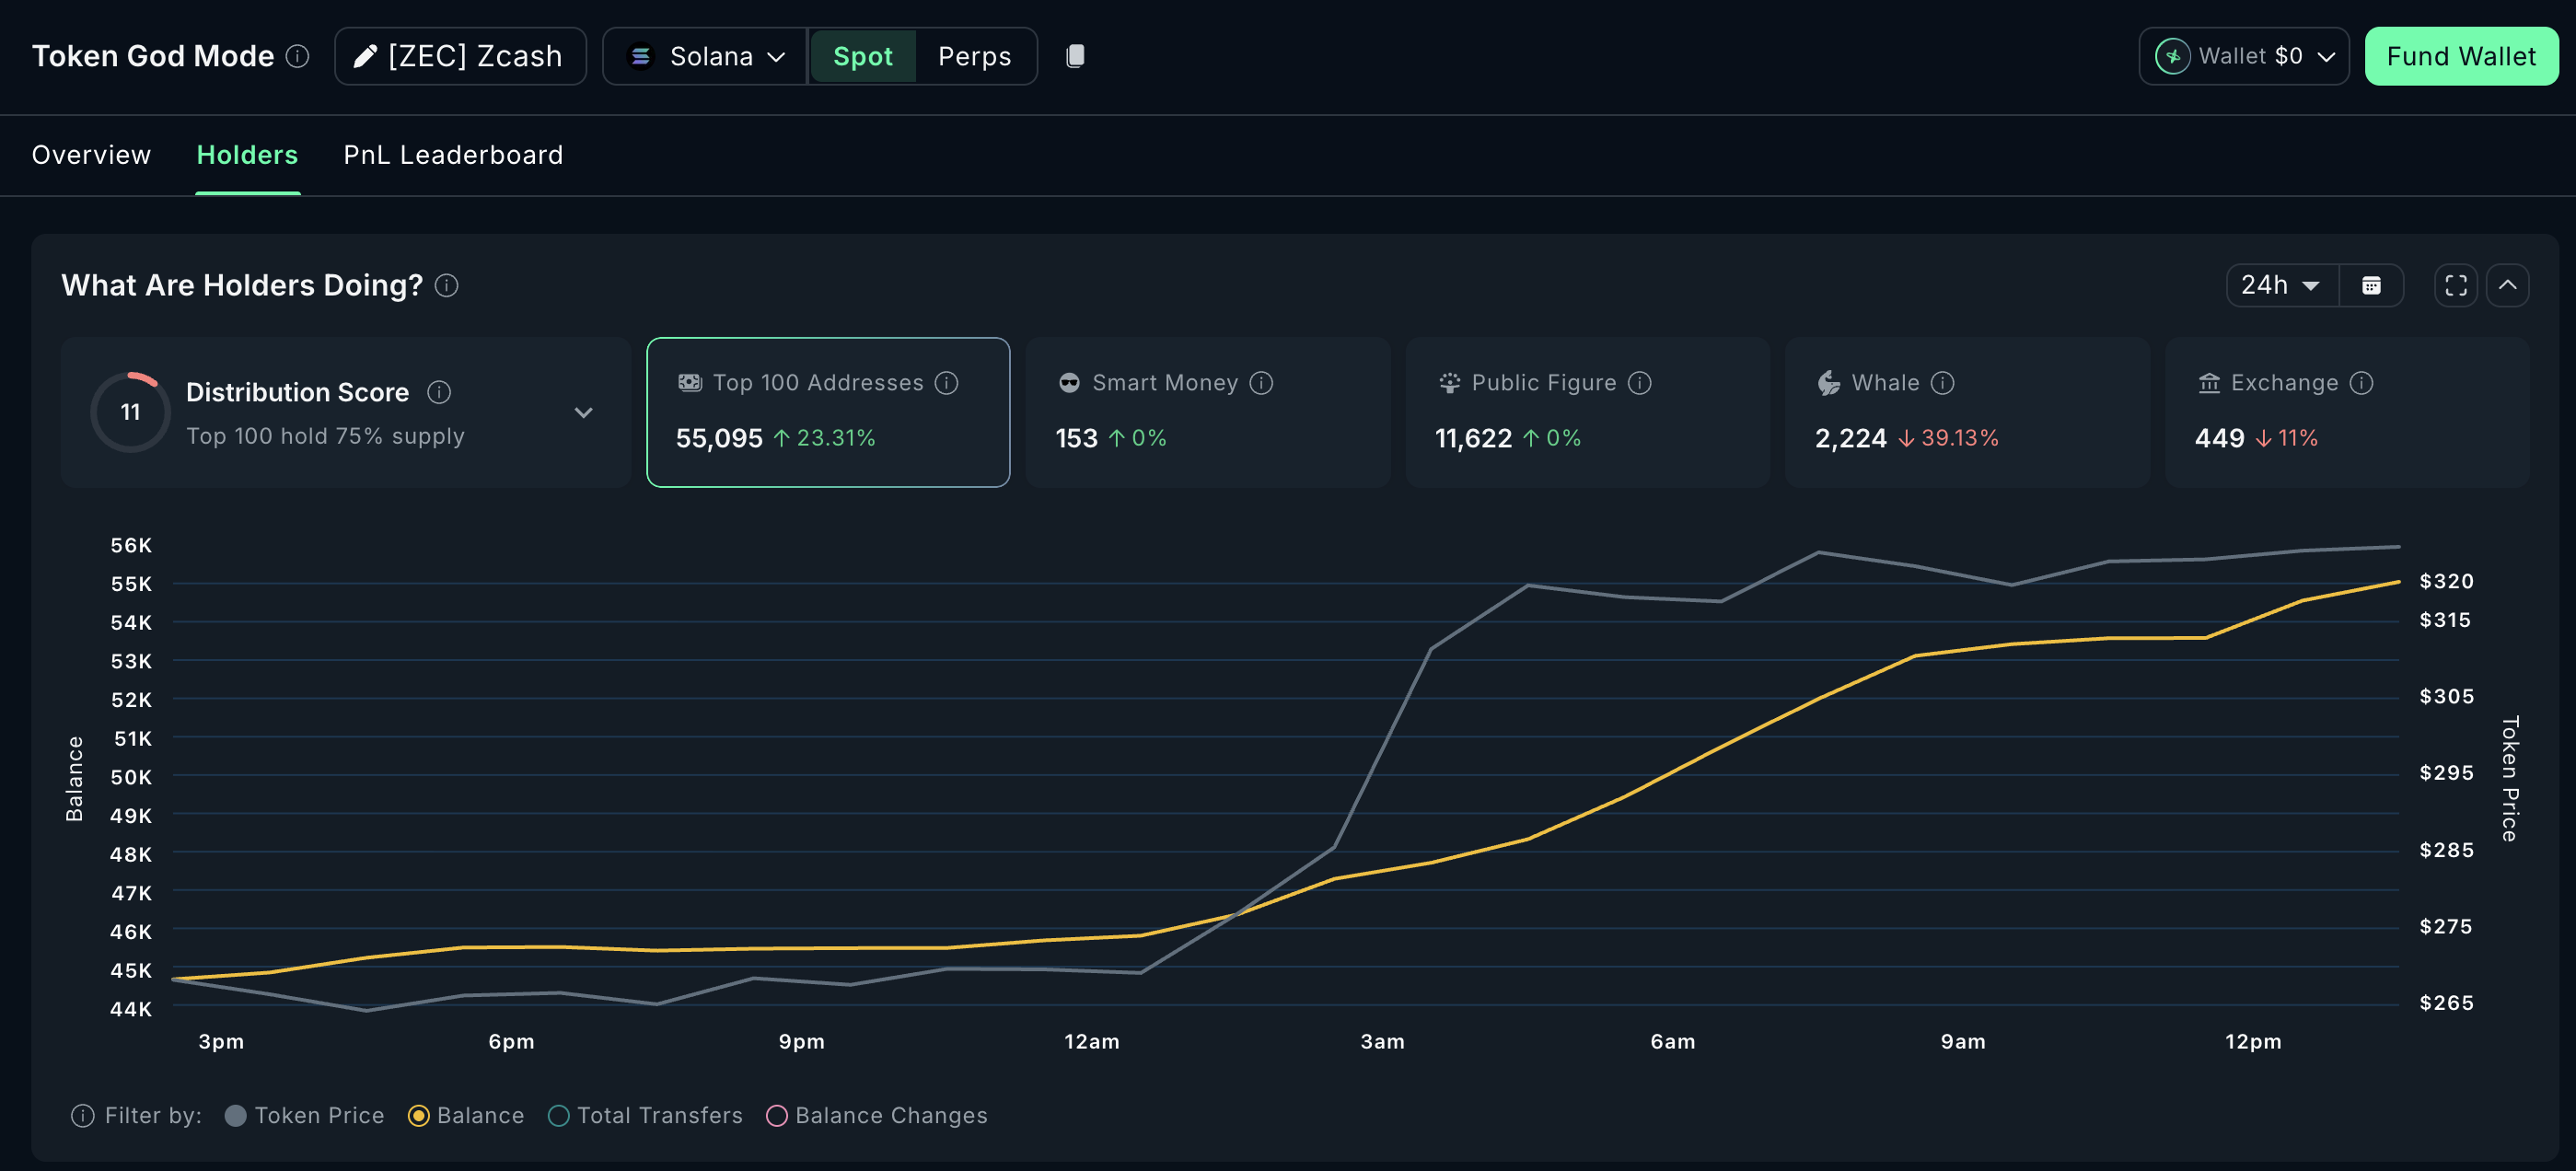
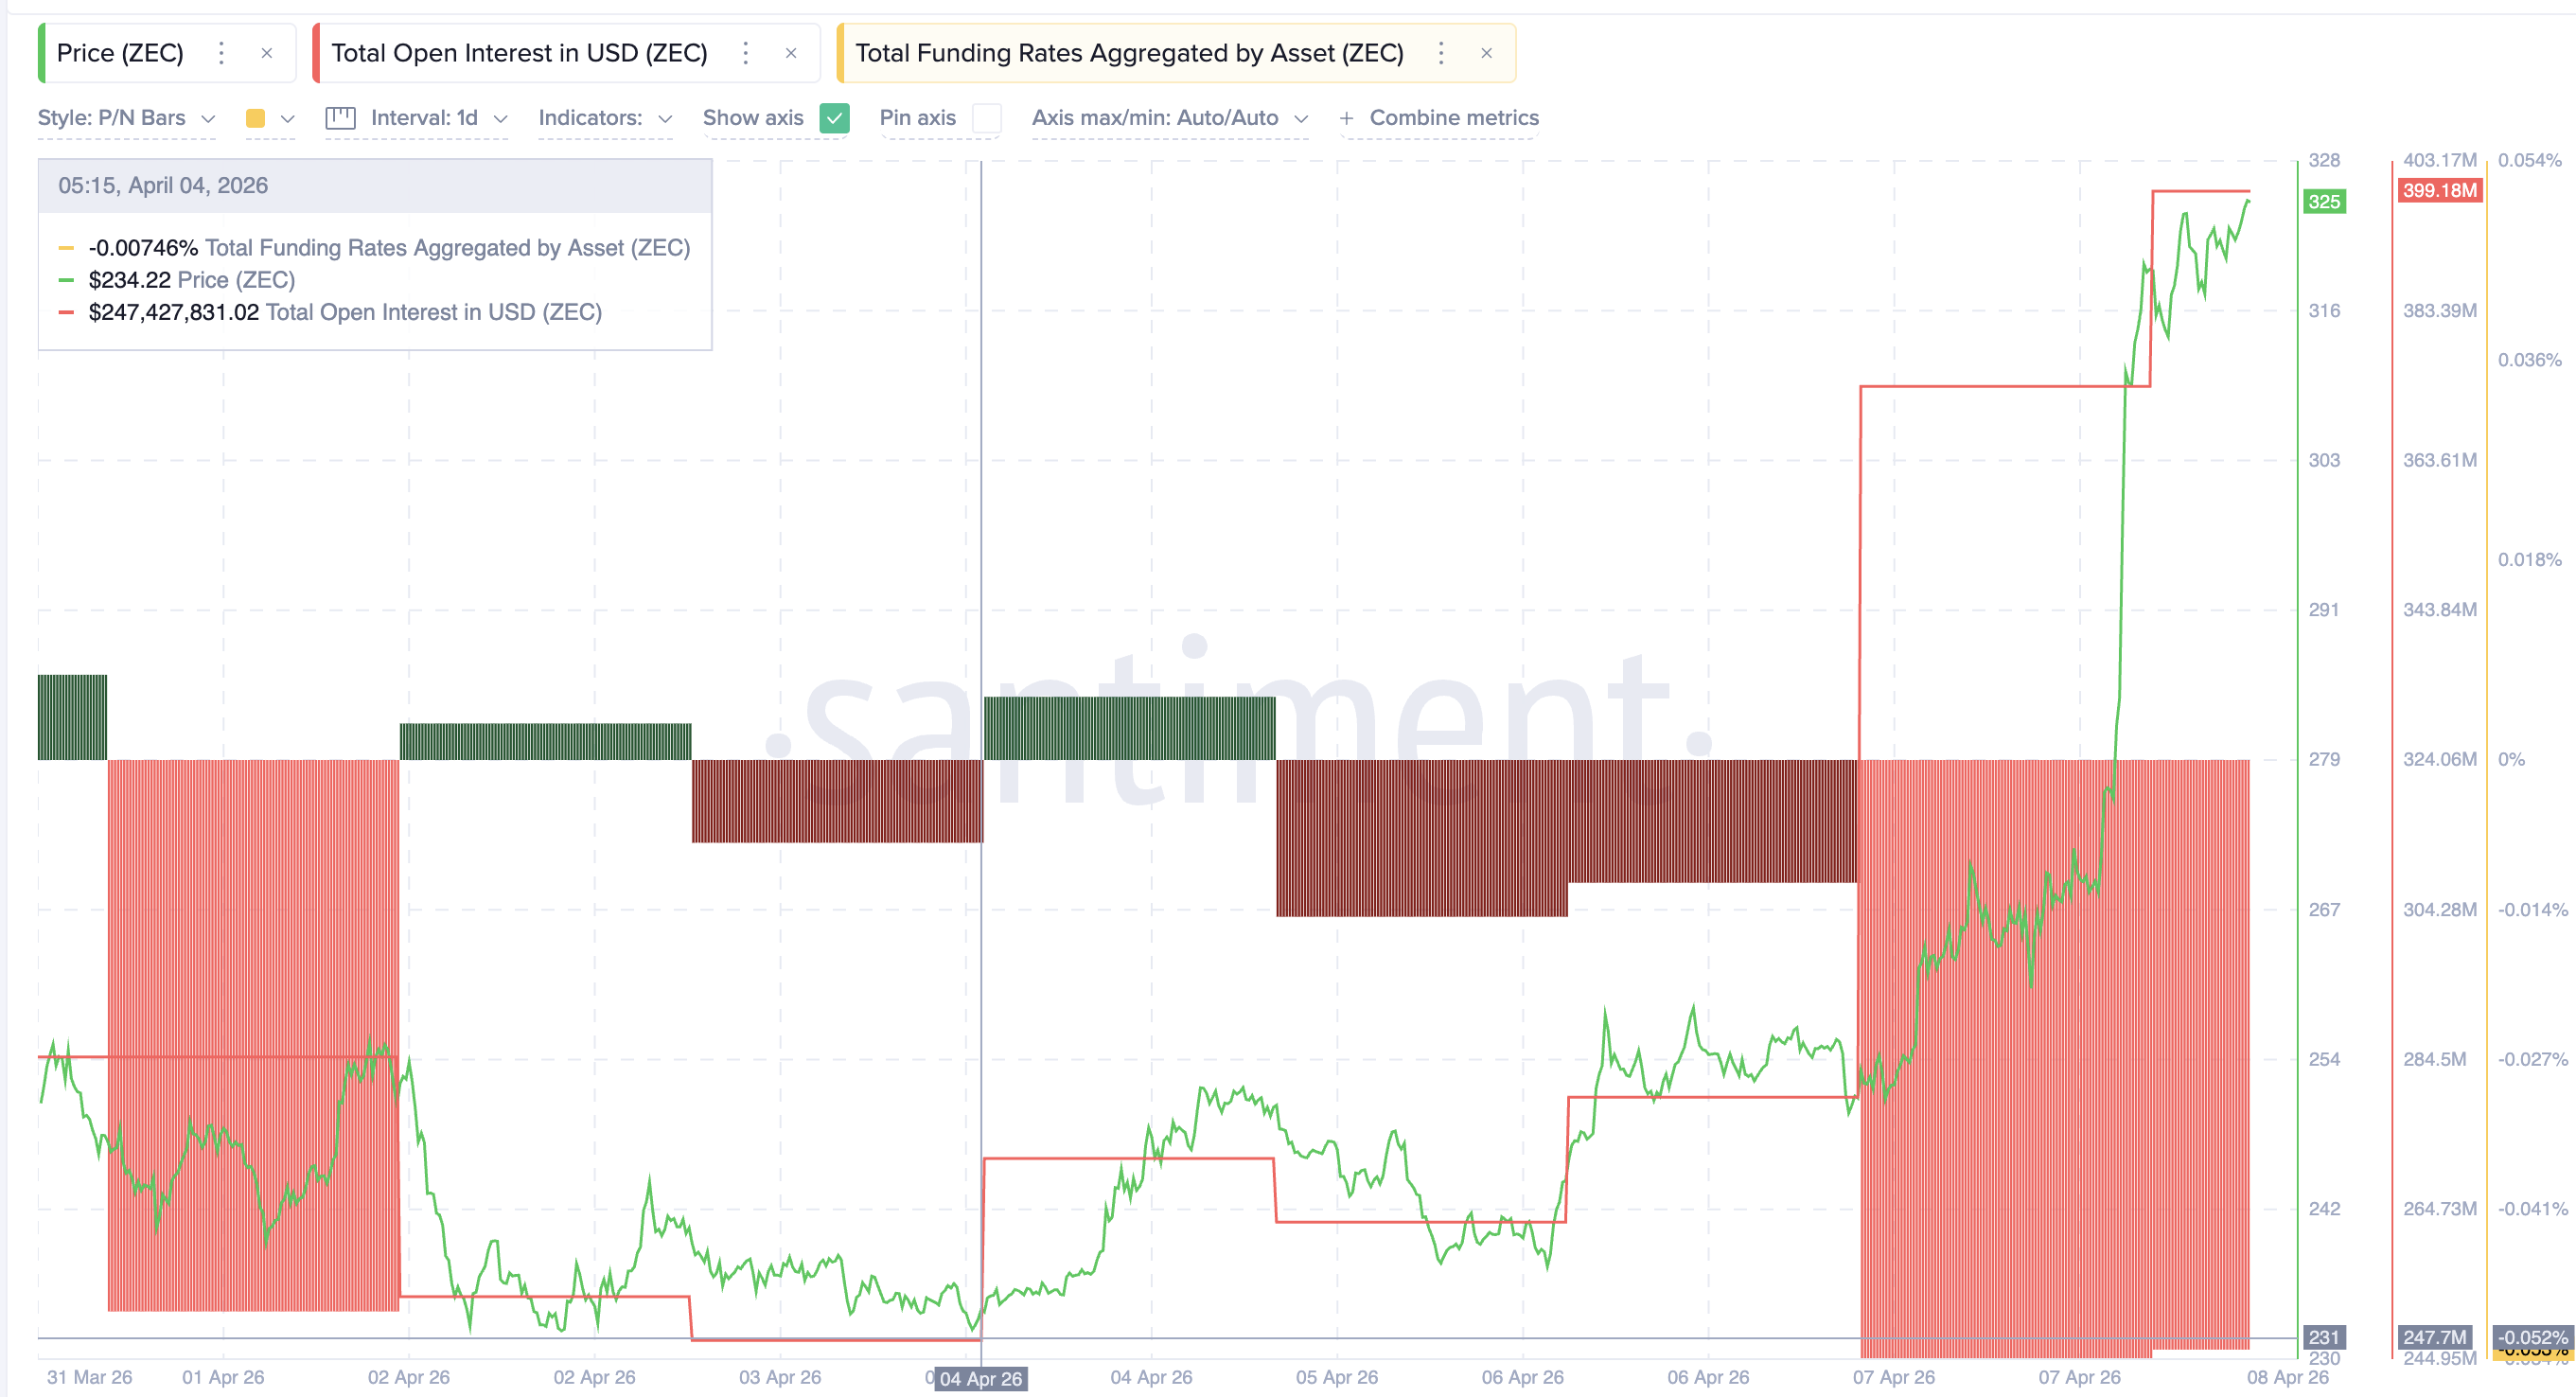
Mega Whales Add 23% but Shorts Build a $399 Million Wall
Recent activity suggests a split in sentiment regarding ZEC on Solana. Data from Nansen shows the largest 100 ZEC holders increased their holdings by about 10,413 ZEC (around $3.4 million) in the last 24 hours – a 23.31% increase. Instead of selling during the recent price increase, these large holders seem to be buying more.
Some smaller Zcash holders sold off about $467,000 worth of ZEC, representing a 39% decrease in their holdings. At the same time, the amount of ZEC held on exchanges also decreased by 11%. However, larger holders—often called ‘mega whales’—moved approximately $2.9 million into their wallets, which offset the selling pressure from the smaller holders and kept the overall trend of Zcash holdings positive.
Interestingly, the derivatives market tells a different story. Open interest – a measure of active contracts – surged by 61%, going from $247.7 million on April 4th to $399.18 million. At the same time, the funding rate has fallen to -0.05%. This negative rate suggests that traders betting the price will go down (short sellers) are paying a fee to maintain their positions, signaling strong expectations of a price decline.
There are two likely scenarios for ZEC’s price. If the price goes up, traders who bet against it (short sellers) might be forced to buy back in, which would drive the price even higher. However, if the price doesn’t rise, those who bet against it will be proven right, and the price could fall quickly. Some large investors seem to be preparing for a big price increase. Ultimately, the ZEC price chart will show which of these outcomes happens first.
Zcash Price Levels That Determine How High ZEC Can Go
ZEC is currently trading at $326. It’s facing some resistance around $328, which has stopped it from going higher so far. If the price can stay above $328 for 12 hours, it’s likely to climb further.
A positive sign for the market is that the 50-day Exponential Moving Average (EMA), which focuses on recent price changes, is getting closer to the 100-day EMA when looking at a 12-hour chart. This suggests a potential upward trend.
As an analyst, I’m watching for a bullish crossover – that’s when the shorter-term moving average moves above the longer-term one. If we see that happen, it would strengthen the technical case for a breakout, essentially confirming what the price action is already suggesting.
Okay, so I’m watching this crypto, and it’s looking good. If it breaks above $328, I’m aiming for $362 next. Getting past $362 could really open things up and push it towards $412. But here’s the thing – if it *does* hit that initial target, it’s important to remember that momentum can fade. To go higher from there, we’d need some new, strong buying pressure, or maybe a short squeeze – that’s where people who bet against it are forced to buy to cover their positions, which drives the price up. That’s probably what would push it beyond the initial projections.
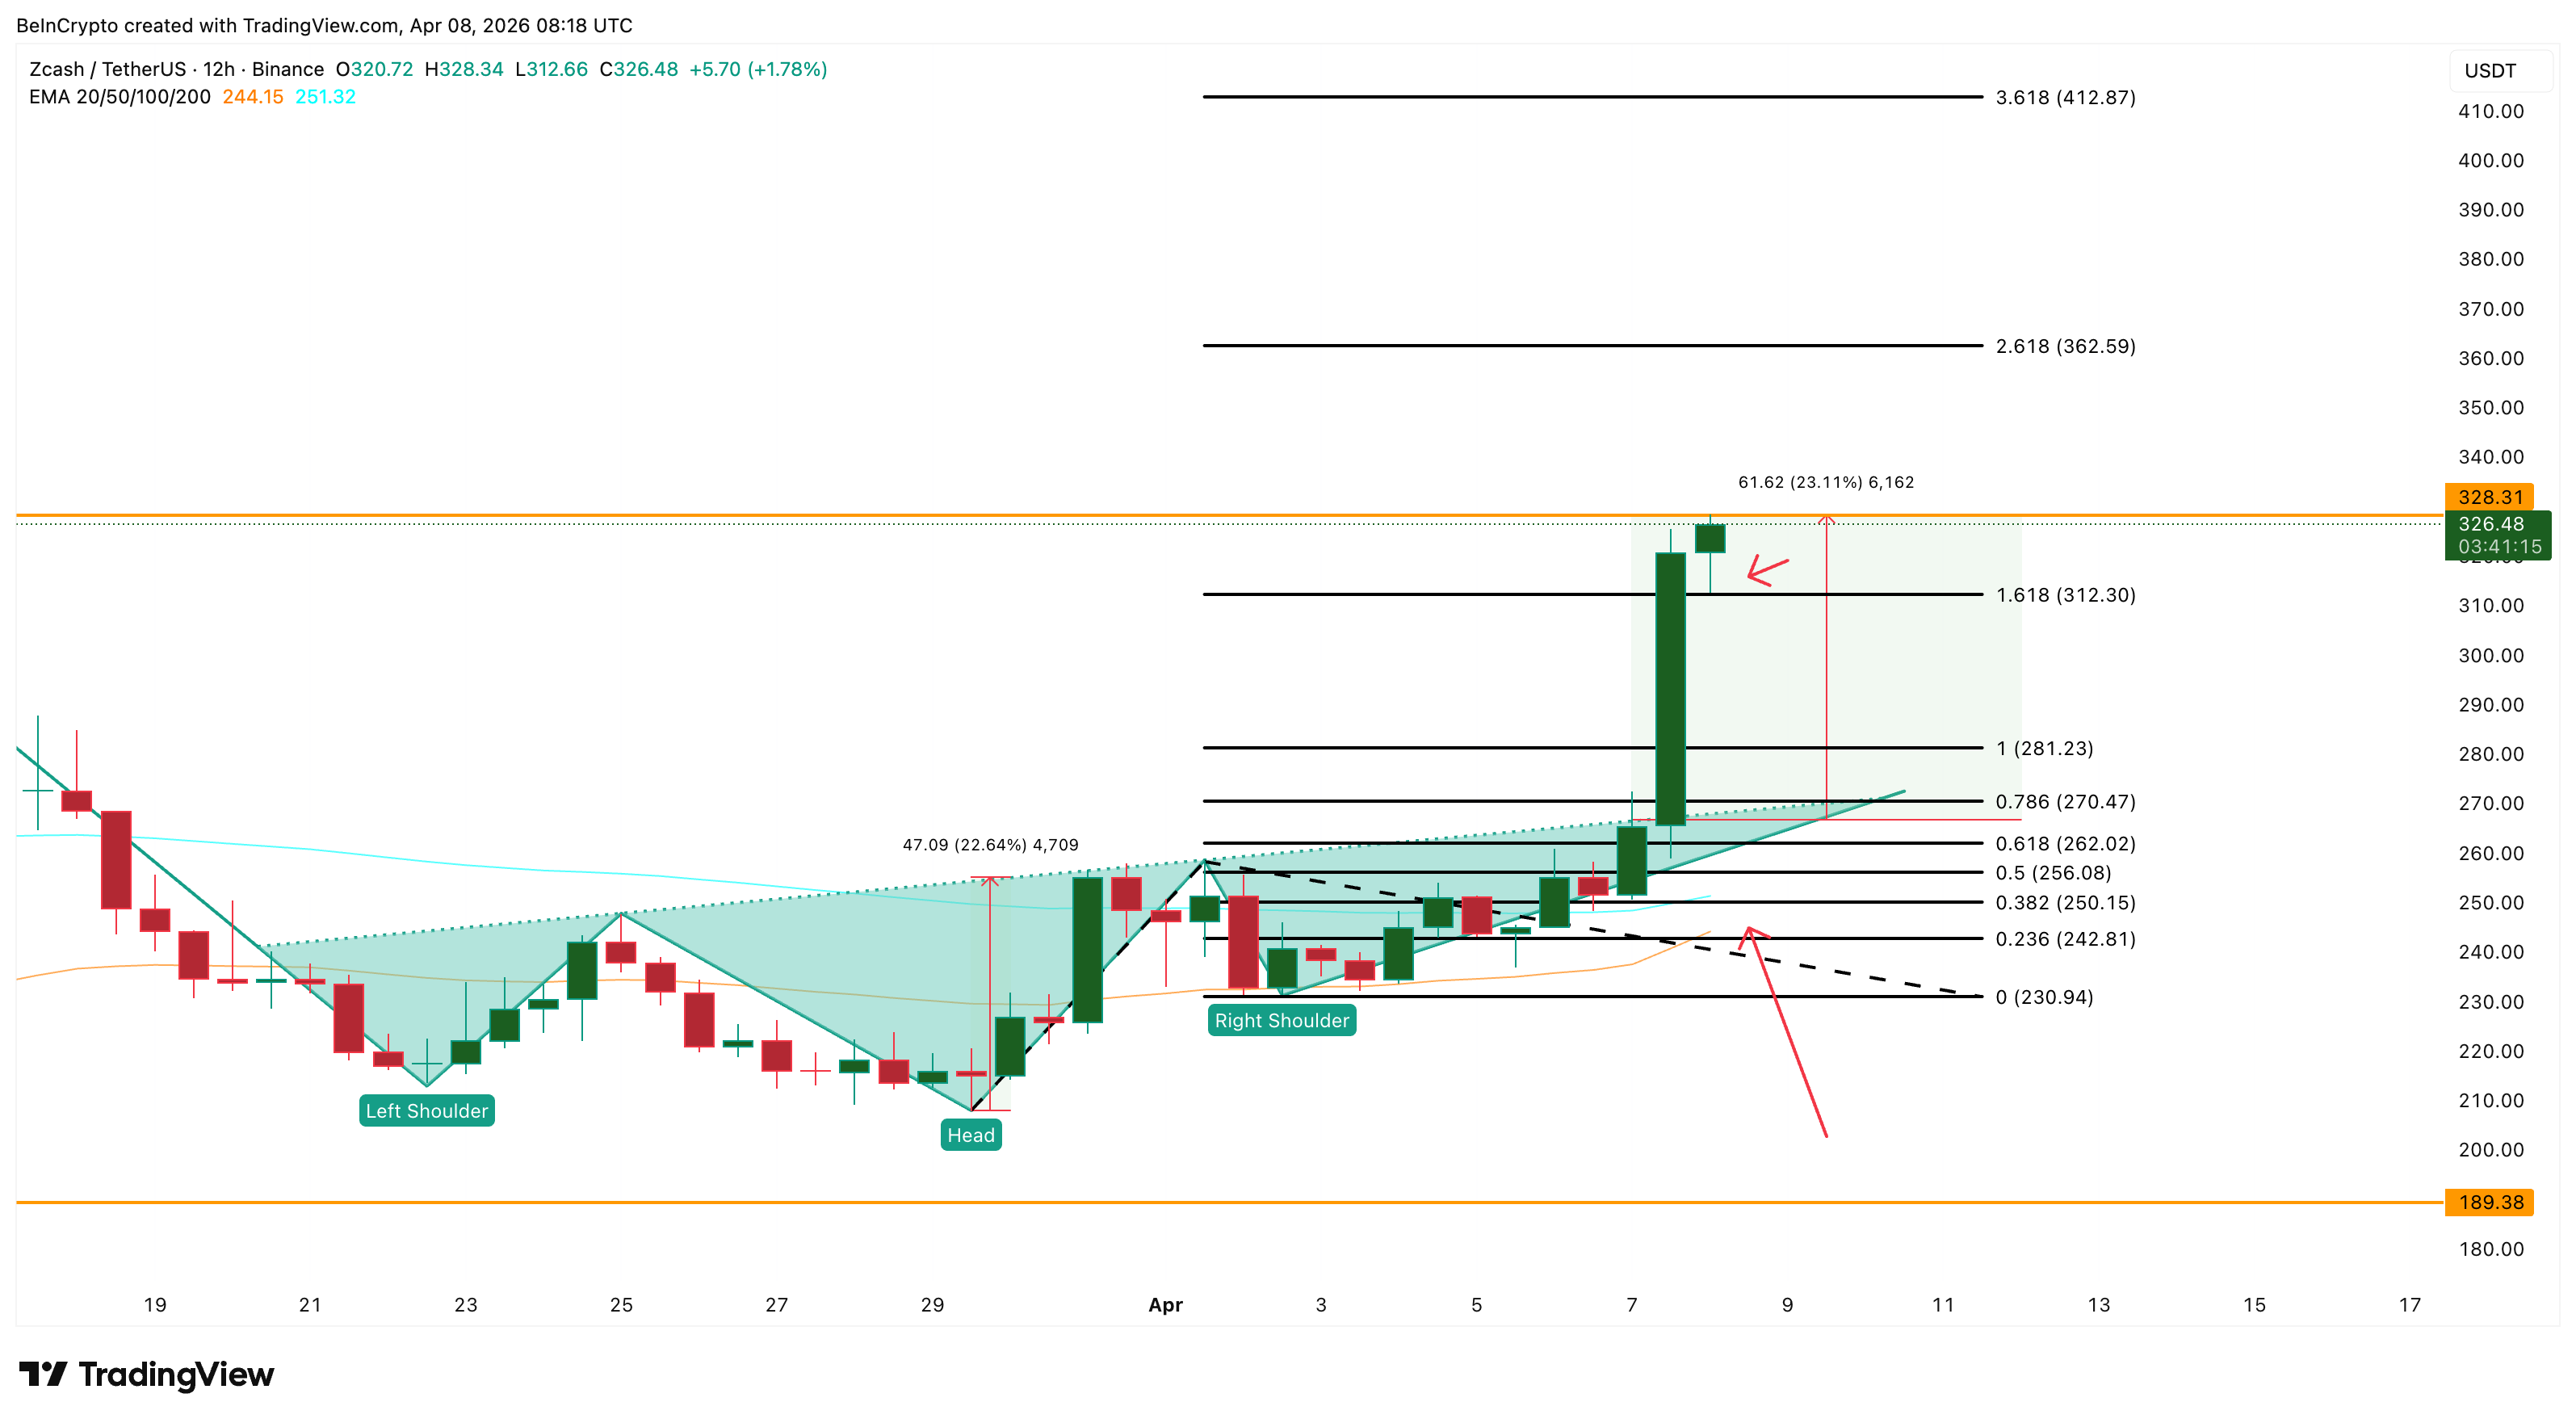
As a ZEC investor, I’m watching the $312 level closely. It’s a key support, and the price action on April 7th showed strong buying pressure there, which is a good sign. However, if the price drops below $312, things could get tricky. It might force some investors to sell, potentially pushing the price down to around $281 and even $270 if the selling really picks up.
The price is currently at $328. If buying pressure continues, it could rise to $362. However, if it falls, $312 will be a key level to watch, as a drop below that could signal the recent upward move was just a temporary spike.
Read More
- Gold Rate Forecast
- BTC PREDICTION. BTC cryptocurrency
- APT PREDICTION. APT cryptocurrency
- ZEC PREDICTION. ZEC cryptocurrency
- BNB PREDICTION. BNB cryptocurrency
- USD CNY PREDICTION
- SOL PREDICTION. SOL cryptocurrency
- WLD PREDICTION. WLD cryptocurrency
- USD JPY PREDICTION
- NEAR PREDICTION. NEAR cryptocurrency
2026-04-08 15:06