This week, Bitcoin’s price stayed steady above $80,000. Growing interest from institutional investors and positive technical indicators suggest that the price could soon try to reach the anticipated $100,000 level.
Summary
- Bitcoin price held above $80,000 as spot Bitcoin ETFs recorded $131 million in net inflows, reversing the previous day’s $635 million in outflows.
- BTC remained resilient amid progress on the proposed CLARITY Act and growing capital rotation from gold and silver into BTC.
- Bitcoin’s 50-day SMA is approaching a bullish golden cross above the 200-day SMA, while bulls target a breakout toward the $85,000–$88,000 resistance zone.
On May 15th, Bitcoin was trading around $80,500, according to crypto.news. It briefly reached over $81,800 earlier in the day. Despite some recent market uncertainty, Bitcoin is still almost 32% higher than its low point in February (around $61,000), and buyers are continuing to support the overall upward trend that began in March.
Positive feelings in the crypto market have grown this week, largely because of increasing hope for clear rules in the U.S. The CLARITY Act, a proposed law, is moving forward in the Senate, and many believe it’s a significant step towards establishing how digital assets will be regulated. This could encourage more large institutions to invest in the crypto sector.
Recent improvements in regulations seem to be boosting interest in Bitcoin from institutional investors. Data from SoSoValue shows that U.S. Bitcoin ETFs saw about $131 million in net inflows on Thursday, a significant turnaround from the $635 million in outflows seen the day before, which had briefly caused some market concern earlier in the week.
Money flowing back into Bitcoin ETFs boosted overall market optimism and confirmed that strong, long-term interest from institutions in Bitcoin persists, even with occasional price swings.
Recently, experts have observed a growing trend of investors shifting money from traditional safe investments like gold and silver into Bitcoin. This seems to be happening because worries about government debt, ongoing inflation, and the declining value of traditional currencies are increasing worldwide.
Recently, Bitcoin has started to move independently of major Asian stock markets like Japan’s Nikkei 225 and Hong Kong’s Hang Seng Index. Even as these indexes declined due to rising oil prices and general economic concerns, Bitcoin maintained its upward trend and continued to attract investment.
Despite some improvements, significant economic risks remain. This week, the price of WTI crude oil jumped above $104 a barrel as new geopolitical issues and worries about limited oil supplies fueled inflation concerns worldwide.
Rising oil prices have briefly made investors more cautious, pausing some of the enthusiasm seen after Bitcoin recovered about 20% from its April low point.
Despite some recent price stability, traders are still generally optimistic, as shown by their positions in the derivatives market. Data from CoinGlass indicates a large amount of leveraged trading activity concentrated around the $85,000 level, implying that market makers may be preparing for further price increases if the upward trend resumes.
Bitcoin price analysis
Looking at the daily price chart, Bitcoin is still trading above its important short- and medium-term moving averages. Since hitting a low around $61,000 in February, the price has generally been making higher lows, suggesting a continuing upward trend.
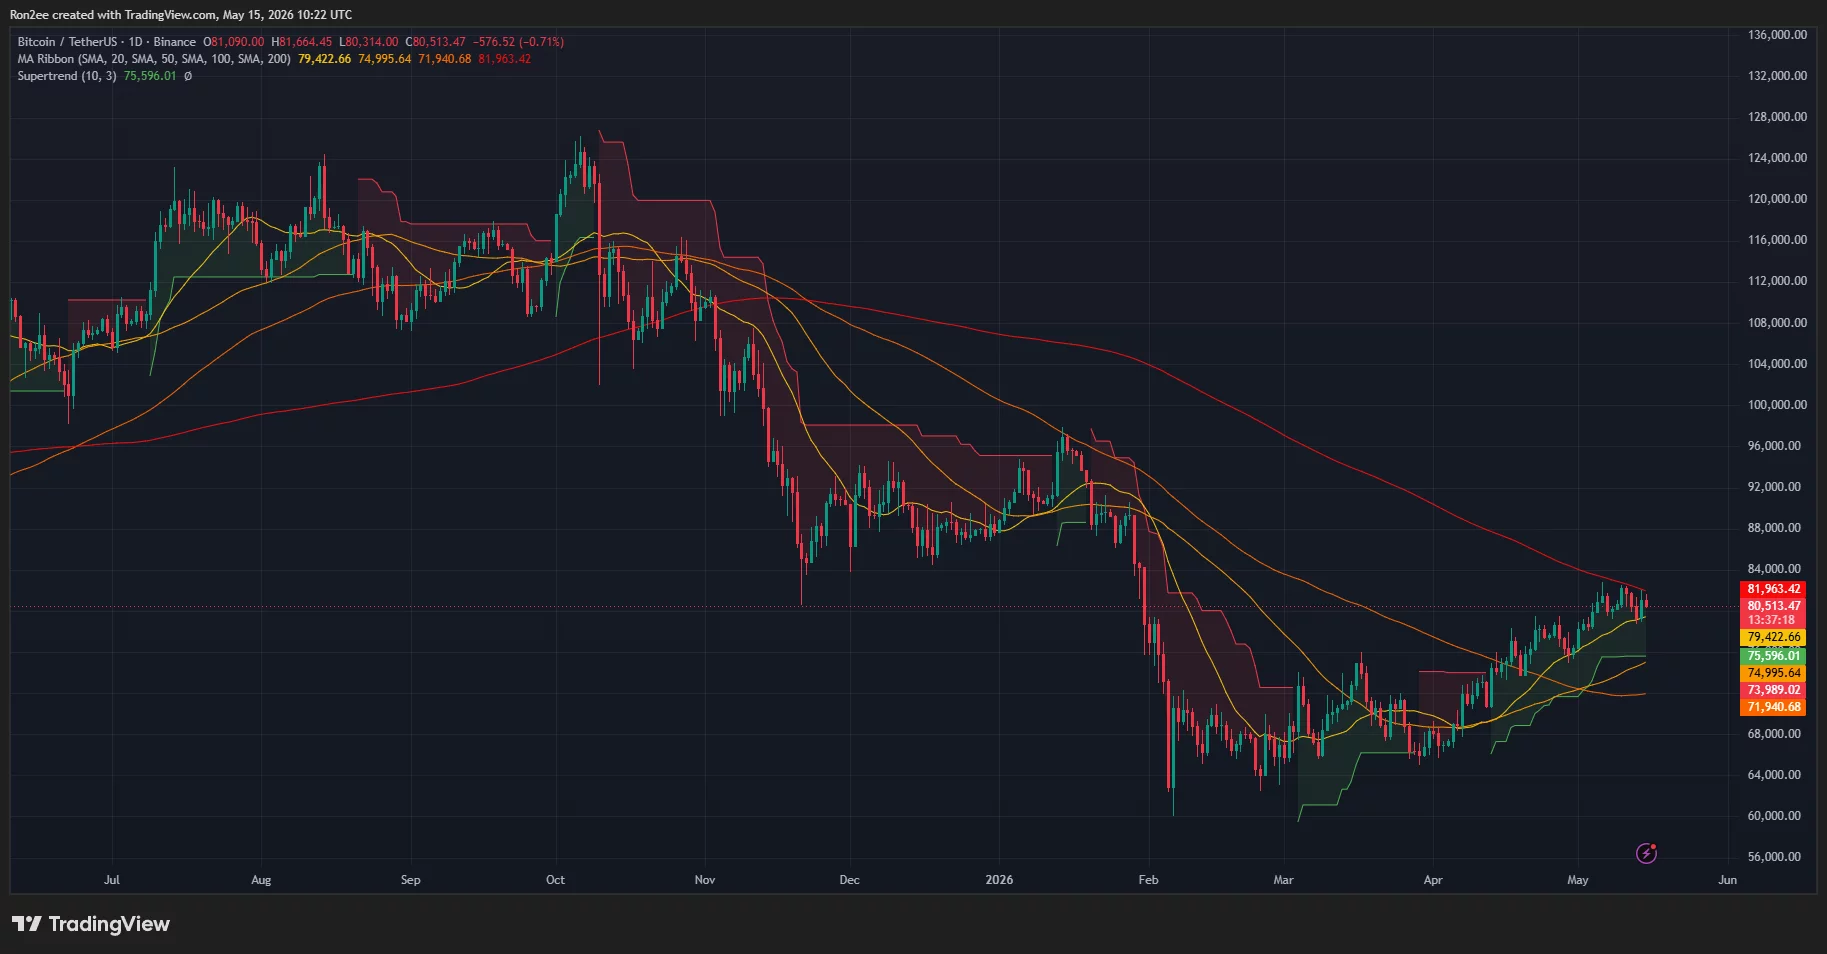
As I’ve been tracking Bitcoin, I’ve noticed something interesting: the 50-day moving average is quickly moving towards crossing above the 200-day moving average. Traders call this a ‘golden cross,’ and it’s often a sign that the price is starting to trend upwards for the long term. Looking back at previous Bitcoin cycles, this pattern has often appeared just before significant price increases.
The Supertrend indicator is still showing a strong buying trend around $75,500, suggesting that buyers are still in control even though the price has recently paused below a resistance level.
Bitcoin has recently risen above key moving averages for both 20 and 100 days, and remains above the significant $80,000 price level.
Overall, the market still appears to be trending upwards, according to momentum indicators. While the MACD remains positive, its recent behavior suggests the upward momentum may be slowing down as the market pauses before potentially breaking through a resistance level.
As an analyst, I’m watching Bitcoin closely. If we see the price break back above around $82,300, I expect we’ll likely test the resistance between $85,000 and $88,000 again. A strong move *through* that resistance could open the door to a significant rally, potentially pushing Bitcoin up another 13% to 24% toward the $100,000 mark over the next few weeks.
If the price falls below $80,000, it could signal further declines for Bitcoin, potentially dropping it to between $76,000 and $75,500. This would represent a roughly 6% decrease from its current price.
Read More
- USD CNY PREDICTION
- Silver Rate Forecast
- EUR HKD PREDICTION
- Gold Rate Forecast
- USD THB PREDICTION
- USD AUD PREDICTION
- CNY JPY PREDICTION
- USD RUB PREDICTION
- GBP EUR PREDICTION
- EUR USD PREDICTION
2026-05-15 14:04