With bullish momentum accelerating faster than a herd of stampeding unicorns, Ethereum is now approaching the key $3,000 level and may surpass it before the end of the month. And if you believe that, I’ve got a bridge made of solid gold to sell you.
Ethereum Price Today Surges Past $2,800 on ETF Inflows
Ethereum’s price climbed to a high of $2,821.56 on July 10, the strongest level recorded since June 12. This upward momentum was largely driven by a renewed surge in demand for Ethereum spot ETFs, particularly in the United States. According to data from July 9, inflows into Ethereum ETFs spiked to $211.32 million, marking the second-largest daily increase since February.
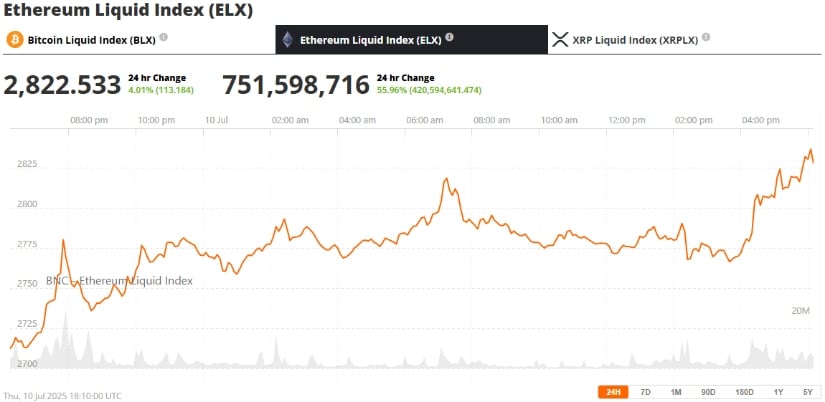
This comes as part of a broader recovery in the crypto market, with Ethereum outperforming several major altcoins over the past 24 hours. ETH/USD rose nearly 5%, solidifying bullish sentiment in the short term.
Despite some early profit-taking, analysts are watching key resistance and momentum indicators closely to determine whether this breakout will hold. Or if it’s just a mirage in the desert of cryptocurrency trading.
Ethereum Chart Analysis: RSI and Structure Signal Bullish Continuation
Technically, Ethereum has broken out of a multi-month symmetrical triangle, a pattern that started in Q1 2025. The previous breakout occurred when ETH broke above the triangle’s apex at approximately $2,770 and retook structural resistance at $2,790. This is supported more by a bullish Break of Structure (BOS) on the Smart Money Concepts chart model.
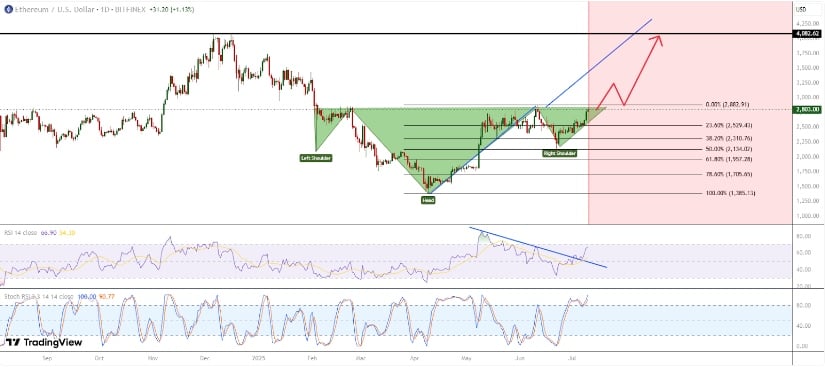
One of the important indicators to watch is the 14-week Relative Strength Index (RSI) at 56.6. The RSI has not fallen below 56.8 since December 2024—when Ethereum last tested prices above $3,000. Should the RSI cross higher into the 57–60 region, it would confirm a continuation of the trend to the upside and leave the $3,000 level vulnerable for retesting. Or, you know, it could just be a fluke.
ETF Momentum and Staking Fundamentals Add to Bullish Outlook
Aside from technical factors, Ethereum ETF news remains a major driver of investor interest. The sudden increase in spot ETF inflows is a sign of institutional accumulation, which usually comes ahead of larger price action. Barring momentum, Ethereum’s ETF approval timeline may turn into a key narrative over the course of July and August. Or maybe it’s just a bunch of people throwing money at a digital piggy bank.
Furthermore, Ethereum’s long-term fundamentals remain strong. Staking rewards, validator activity, and Layer 2 adoption continue to increase. These kinds of ecosystem metrics help to provide price support, especially in the case of bullish trend reversals. Or, they could just be a clever way to distract us from the fact that we’re all living in a simulation.
Ethereum gas fees, although currently modest, may rise if network activity gathers pace alongside prices, still influencing on-chain dynamics. Or, you know, they could just be a clever way to make us all feel like we’re being fleeced by a bunch of digital sheep.
Layer 2 Ecosystem Expands as L2 TVL Climbs
Ethereum’s Layer 2 networks, such as Arbitrum, Optimism, and zkSync, continue to show transaction volume growth and total value locked (TVL). Not only do these solutions help scale Ethereum, but they also drive new capital into the system. With L2 TVL growing, Ethereum benefits from increased network utility and revenue through fees. Or, it could just be a clever way to make us all feel like we’re part of some grand digital experiment.
Layer 2 development on Ethereum remains an important metric to track, particularly as developers look towards subsequent upgrades such as the Dencun release in late 2025. Or, you know, it could just be a clever way to keep us all guessing.
Ethereum Price Prediction: Is $3,000 the Next Stop?
With current momentum, most traders expect Ethereum to reclaim the $3,000 level within the month—a level not visited since the beginning of 2024. The symmetrical triangle bullish breakout and ETF inflow acceleration are a good setup for additional gains. Or, it could just be a clever way to make us all feel like we’re part of some grand digital lottery.
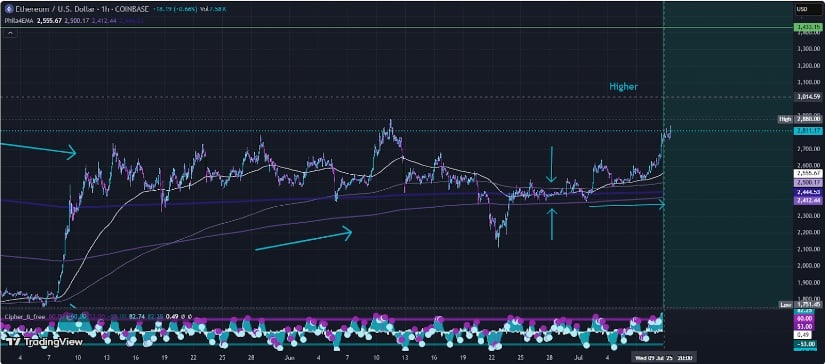
However, traders need to be vigilant regarding potential resistance at $2,850 and $2,900. It’s only a clean breakout above $2,950 that will provide a clean move above $3,000. Or, you know, it could just be a clever way to make us all feel like we’re part of some grand digital soap opera.
If Ethereum converts $2,800 into support and RSI continues to rise, a rally to $3,200 cannot be discounted in the near term. Or, it could just be a clever way to make us all feel like we’re part of some grand digital rollercoaster.
Looking Ahead: Ethereum Outlook Remains Bullish
The combination of ETF flows, technical breakout patterns, and growing Layer 2 usage places Ethereum into a favorable setup during July. If momentum continues to be upward and on-chain metrics continue to improve, Ethereum can overtake Bitcoin in the short term and restore a leadership position in the broader crypto rally. Or, you know, it could just be a clever way to make us all feel like we’re part of some grand digital game of thrones.
Volatility remains a factor, as always with markets, but Ethereum’s price prediction now is bullish—potentially setting up for a breakout summer. Or, it could just be a clever way to make us all feel like we’re part of some grand digital adventure.
Read More
- Brent Oil Forecast
- Silver Rate Forecast
- EUR AUD PREDICTION
- Gold Rate Forecast
- TRX PREDICTION. TRX cryptocurrency
- Oh, the Folly! Strategy’s Bitcoin Splurge: $1.57 Billion on Digital Dreams!
- DigiVault: India’s Crypto Custody Circus Arrives Amid Regulatory Tightrope
- Banks’ New Blockchain Plan: Don’t Panic!
- XDC PREDICTION. XDC cryptocurrency
- Shocking Chainlink Surge! Whale Robins Crawl Back In
2025-07-10 23:22