Ethereum’s Sunday rally? Oh, it’s just a corrective B-wave, darling. Don’t get your hopes up until it hits $2,420. Then we’ll talk.
So, Ethereum bounced off its Sunday low. Big whoop. My cat bounces off the couch with more conviction. But hey, not every upward twitch is a breakout. Let’s not throw confetti just yet.
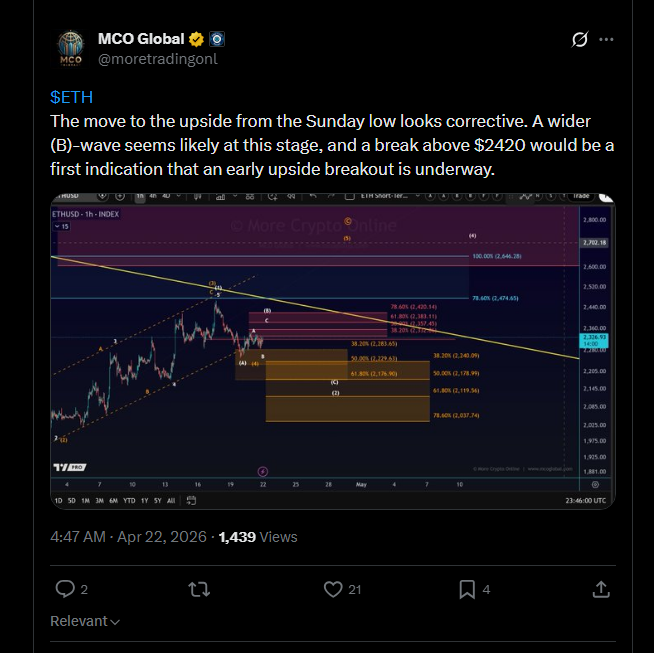
According to MoreTradingOnline (yes, that’s a real name), this little upside jig is just a corrective price action. Apparently, it’s part of a wider (B)-wave, which is basically the financial equivalent of a “fake recovery.” It’s like when you tell yourself you’re over your ex, but then you cry into a tub of ice cream at 2 a.m. Spoiler: the ice cream doesn’t care.
The magic number? $2,420. Because, of course, it’s $2,420. Not $2,419. Not $2,421. Just $2,420. Someone’s been watching too many late-night infomercials.
Source: MoreTradingOnline (because who doesn’t trust a source with “More” in the name?)
$2,420: The Breakout Gate or the Bull’s Trap Door?
MoreTradingOnline (yes, them again) says a break above $2,420 would be the first sign of a real breakout. Until then, it’s all just financial theater. Pass the popcorn.
The chart (attached, because who doesn’t love a good chart?) shows ETH trapped in a descending wedge on the 1-hour timeframe. Fibonacci levels are mapping out potential (B)-wave targets, with 78.60% resistance near $2,474. The corrective zone? Oh, it’s just hanging out between $2,176 and $2,420. Casual. If bulls can’t flip $2,420, the (C)-wave could drag prices lower. Because why not?
Last spotted: ETH near $2,326. Thrilling, I know.
The broader Ethereum price picture? It’s been stuck in the $2,000 to $2,400 range for weeks. Bears have been playing bouncer, keeping the party contained. Sunday’s low? Just another night at the club.
The Wave Count: More Exciting Than It Sounds
Elliott Wave counts on the hourly chart show a five-wave sequence completed from earlier highs. Waves 1 through 5, because why stop at four? What follows? Correction, of course. That’s where ETH is now, taking a little financial nap.
The (A)-(B)-(C) corrective structure (thanks, MoreTradingOnline) puts ETH in the middle of a (B)-wave bounce. If this is right, a (C)-wave leg down could follow, with Fibonacci targets at $2,176 or even $2,037. Because nothing says “fun” like a 12% drop.
Ethereum’s done this before, stalling at Fibonacci zones like a teenager at a mall food court. Will it resume the drop or reverse sharply? Stay tuned.
The flip side? A clean push above $2,420 changes everything. It would suggest the correction ended at Sunday’s low, and ETH is already in an early impulse higher. Bulls, start your engines.
What If $2,420 Holds as Resistance? Spoiler: It’s Not Pretty
If $2,420 holds, it’s like the financial version of a breakup. A failed test followed by a reversal lower would confirm the (B)-wave top. The (C)-wave target range? Between $2,178 and $2,037. That’s a 12% drop from current levels. Ouch.
Nothing’s confirmed until the price acts. $2,420 is the line in the sand-breakout or bull trap. Traders, grab your hourly charts and buckle up.
Disclaimer: This article is based purely on technical analysis and sourced reporting. It does not constitute financial or investment advice. Also, I’m not your therapist, so don’t @ me if you lose your shirt.
Read More
- Brent Oil Forecast
- Silver Rate Forecast
- Gold Rate Forecast
- Trump’s Oil Fantasy: Seize, Profit, and Declare Victory in the Straits of Hormuz
- You Won’t Believe 35% of Crypto Users Lost Their Wealth to Simple Human Error!
- USD TRY PREDICTION
- Solana\’s Slump: Will Traders Wait Forever for a Catalyst?”‘, ‘reasoning_content’: None, ‘name’: None, ‘tool_calls’: None}, ‘finish_reason’: ‘stop’, ‘logprobs’: None}], ‘usage’: {‘prompt_tokens’: 733, ‘total_tokens’: 750, ‘completion_tokens’: 17, ‘estimate
- XRP’s ETF Waltz: $1.2B Inflows, Yet Price Does the Limbo at $1.30
- BTC PREDICTION. BTC cryptocurrency
- ECB Backs EU Crypto Supervision: Binance and Coinbase Face ESMA Oversight
2026-04-22 19:33