Well, here we are again, hovering with bated breath (and, let’s be honest, nervously refreshing TradingView every three minutes). Analysts and keyboard coffee-spillers everywhere are pointing to *intense bullish vibes* as Hedera teeters above the not-at-all-iconic $0.154–$0.156 “danger zone.” (Move over, Top Gun. There’s a new high-stakes drama starring green candlesticks.)
Resistance is barely clinging on at $0.161 – one more well-timed meme tweet and it’ll be waving a white flag. All eyes on whether HBAR will go full soap opera and burst toward $0.172, leaving FOMO sufferers in its wake. 🚀
HBAR: Flagging, Not in Distress (Yet)
Enter Toji (@TradeToji), star chartist and probably someone’s favorite cousin, reporting a bullish “continuation pattern” on the short-term charts. Yes, HBAR has heroically clambered back above the age-old battle zone of $0.154–$0.156, a place previously swarming with, er… *demand* (and despair).
This area, sort of the asset equivalent of a motivational poster, keeps launching HBAR to ever-so-slightly loftier lows. And after a modestly dramatic tussle with resistance, the price now flaunts a classic higher-low setup. Also: a bullish flag. Because apparently every chart pattern is an animal or something out of semaphore.
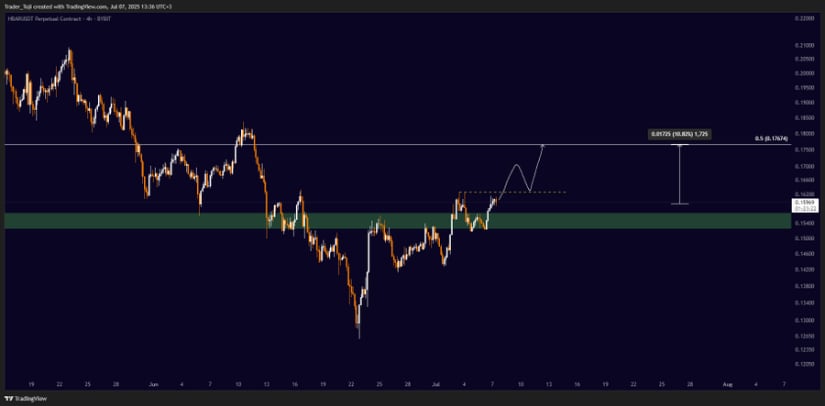
According to the Tojiprophet, expect HBAR to pull back for a quick pit stop near that breakout zone, before (potentially) strapping jetpacks on and aiming for $0.1724. That number isn’t random—it matches up with some Fibonacci thing (math!) and a shadowy resistance from mid-June. Nobody ever said forecasting was sexy.
By the way, if HBAR holds above the magical green box and volume doesn’t run for the hills, we could be looking at an eleventy-one percent rally. (Okay, more like 11%… but let me dream). Fall below $0.154? Pack your bags for “reset town.”
Breakout or Breakdown: The Suspense Is… Bearable
1-hour chart-watchers have seen enough rally-correction cycles in HBAR since late June to start scheduling them into their calendars. After bouncing from $0.15616 (how specific), HBAR’s now wobbling drunkenly toward resistance at $0.16159. The name of the game: stay inside the narrow consolidation channel and pretend it’s all part of the plan.
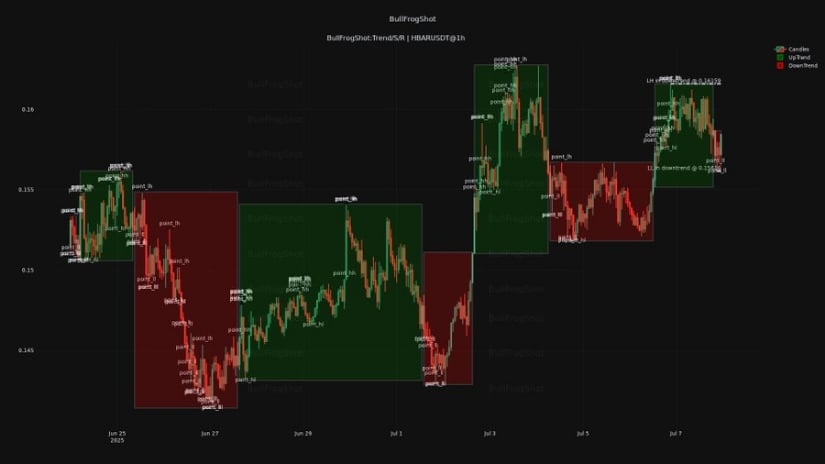
Several price peaks are clustered like anxious pigeons at $0.161, touting the “support me, love me” narrative. Trend’s technically up, even though some saucy red areas are trying to kill the mood.
If HBAR bursts through $0.16159, we might finally get that dramatic follow-through, perhaps triggering actual excitement among traders. Until then: everyone squints at volume and pretends the narrow trading band is all very technical and not at all boring.
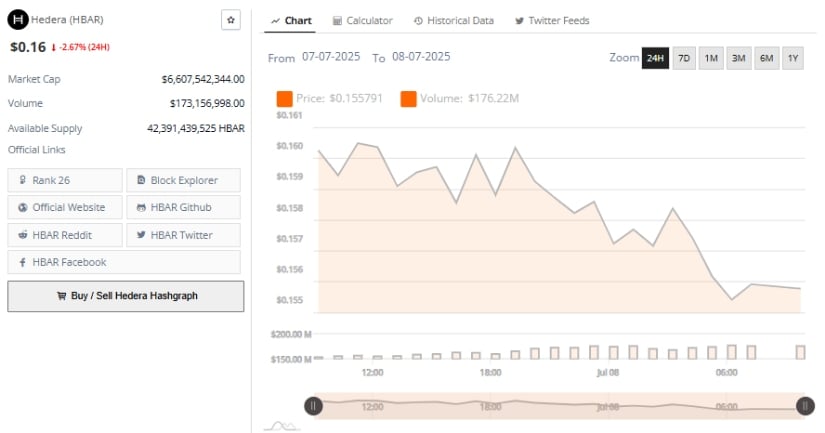
Latest on-chain wisdom: HBAR is at $0.16, having drooped 2.67% in the last 24 hours, as if it, too, saw a Monday morning. Volume crept to $173.1 million. Market cap’s a robust $6.61 billion, landing it 26th globally – just behind “coin you heard of once and forgot immediately.” With 42.39 billion tokens in the wild, at least nobody’s running out.
Momentum Watch: Is That a Pulse?
On the daily charts: HBAR is putting up its feet at $0.155 after a bout of moody corrections. Technicals (which, let’s be honest, are only sometimes right) are flashing tentative recovery signs. RSI has hit 50.11—so it’s not quite supermodel, not quite average—everyone’s waiting to see if it ventures above 55, at which point the crowd may briefly care.
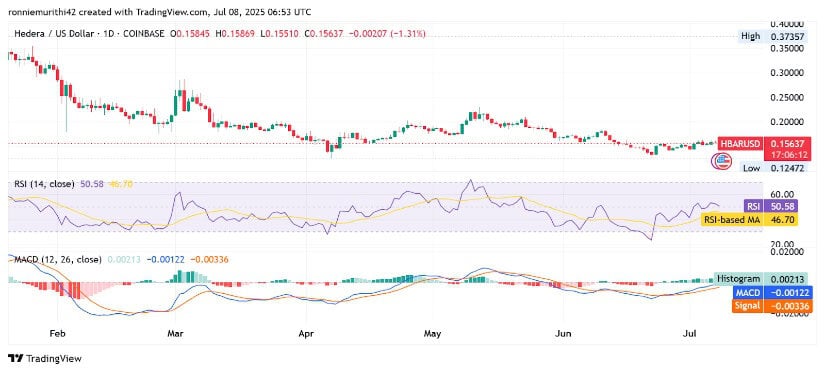
The MACD, beloved by chart nerds everywhere, says: maybe? Currently, MACD line is -0.00127, signal line is -0.00336, there’s a baby-sized histogram bar, and a possible bullish crossover path. If the price actually closes above $0.165 with some extra oomph in volume, then, and only then, does the stampede start toward $0.172–$0.180. Maybe get the popcorn ready.
Until then, as ever, we watch… wait… and craft increasingly dramatic price memes. 🎢
Read More
- Gold Rate Forecast
- Brent Oil Forecast
- CNY JPY PREDICTION
- Silver Rate Forecast
- USD CNY PREDICTION
- USD MYR PREDICTION
- Solana Sensation: Bit Mining’s 250% Stock Surge and the Great Crypto Shift
- USD TRY PREDICTION
- SOL PREDICTION. SOL cryptocurrency
- OP PREDICTION. OP cryptocurrency
2025-07-09 01:09