Ah, the capricious dance of Strategy Inc (MSTR), a stock so enamored with Bitcoin’s whims that it pirouettes with all the grace of a drunken ballerina. On Monday, it leapt 6%, as if inspired by Bitcoin’s weekend frolic. Yet, by Tuesday’s pre-market, it had already stumbled back to $131, a 5% retreat-a financial pas de deux of the absurd.
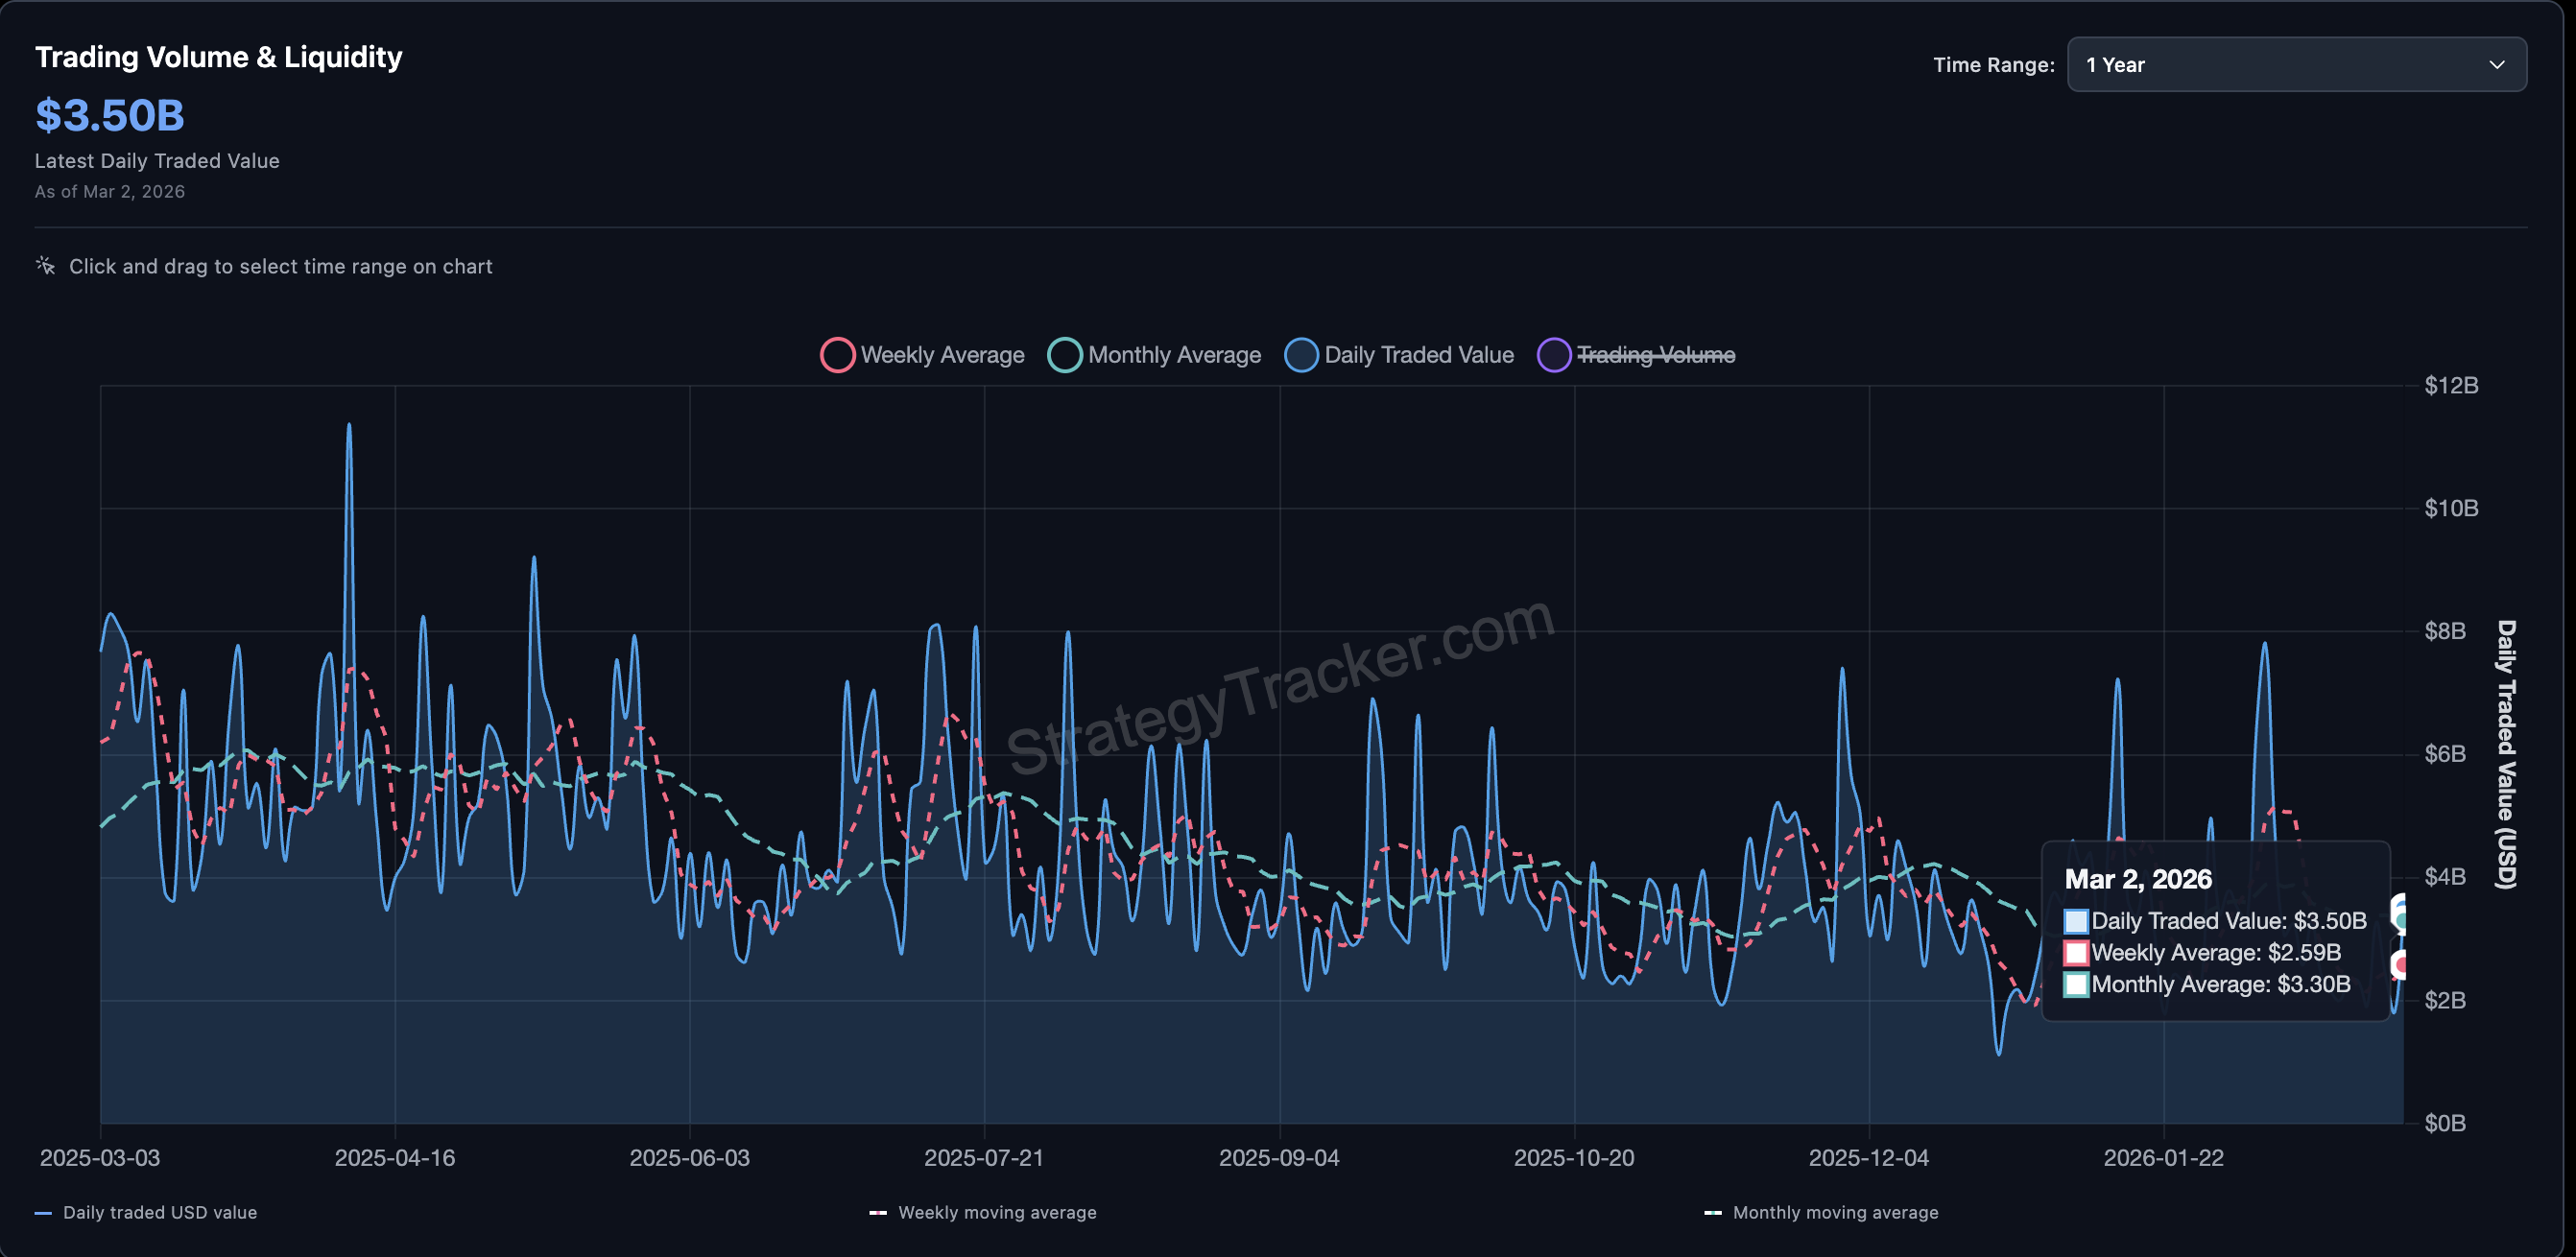
With weekly traded value plummeting 67% from its February zenith and volatility soaring to 106%, the liquidity of MicroStrategy stock has thinned like a poorly brewed tea. This anemic flow threatens to amplify the technical whispers, and $124 looms as the precipice where the farce turns tragic.
Bitcoin’s Bounce: A Farce in Two Acts
Bitcoin, ever the prima donna, plunged to $63,000 over the weekend, only to rebound by Sunday night. MSTR, bound by the constraints of its stockhood, could not react until Monday. Thus, Friday’s close near $129 was a compressed opera, two days of Bitcoin’s drama distilled into a single opening aria-a 6% rally to $137. But, as is the way with such melodramas, Bitcoin slipped back to $66,800 overnight, and Tuesday’s pre-market erased the gains with a yawn.
This is the pattern, you see: Bitcoin’s nocturnal and weekend antics are absorbed by MSTR in violent, almost farcical bursts at market open. A financial commedia dell’arte, if you will.
This compression has thrust 30-day annualized volatility to 105.8%, the highest among major US large-caps-above Bitcoin’s 67.5% and nearly double MSTR’s own yearly average of 57.2%. Volatility, my dear reader, is the spice of life, but in excess, it becomes a hallucinogenic brew.
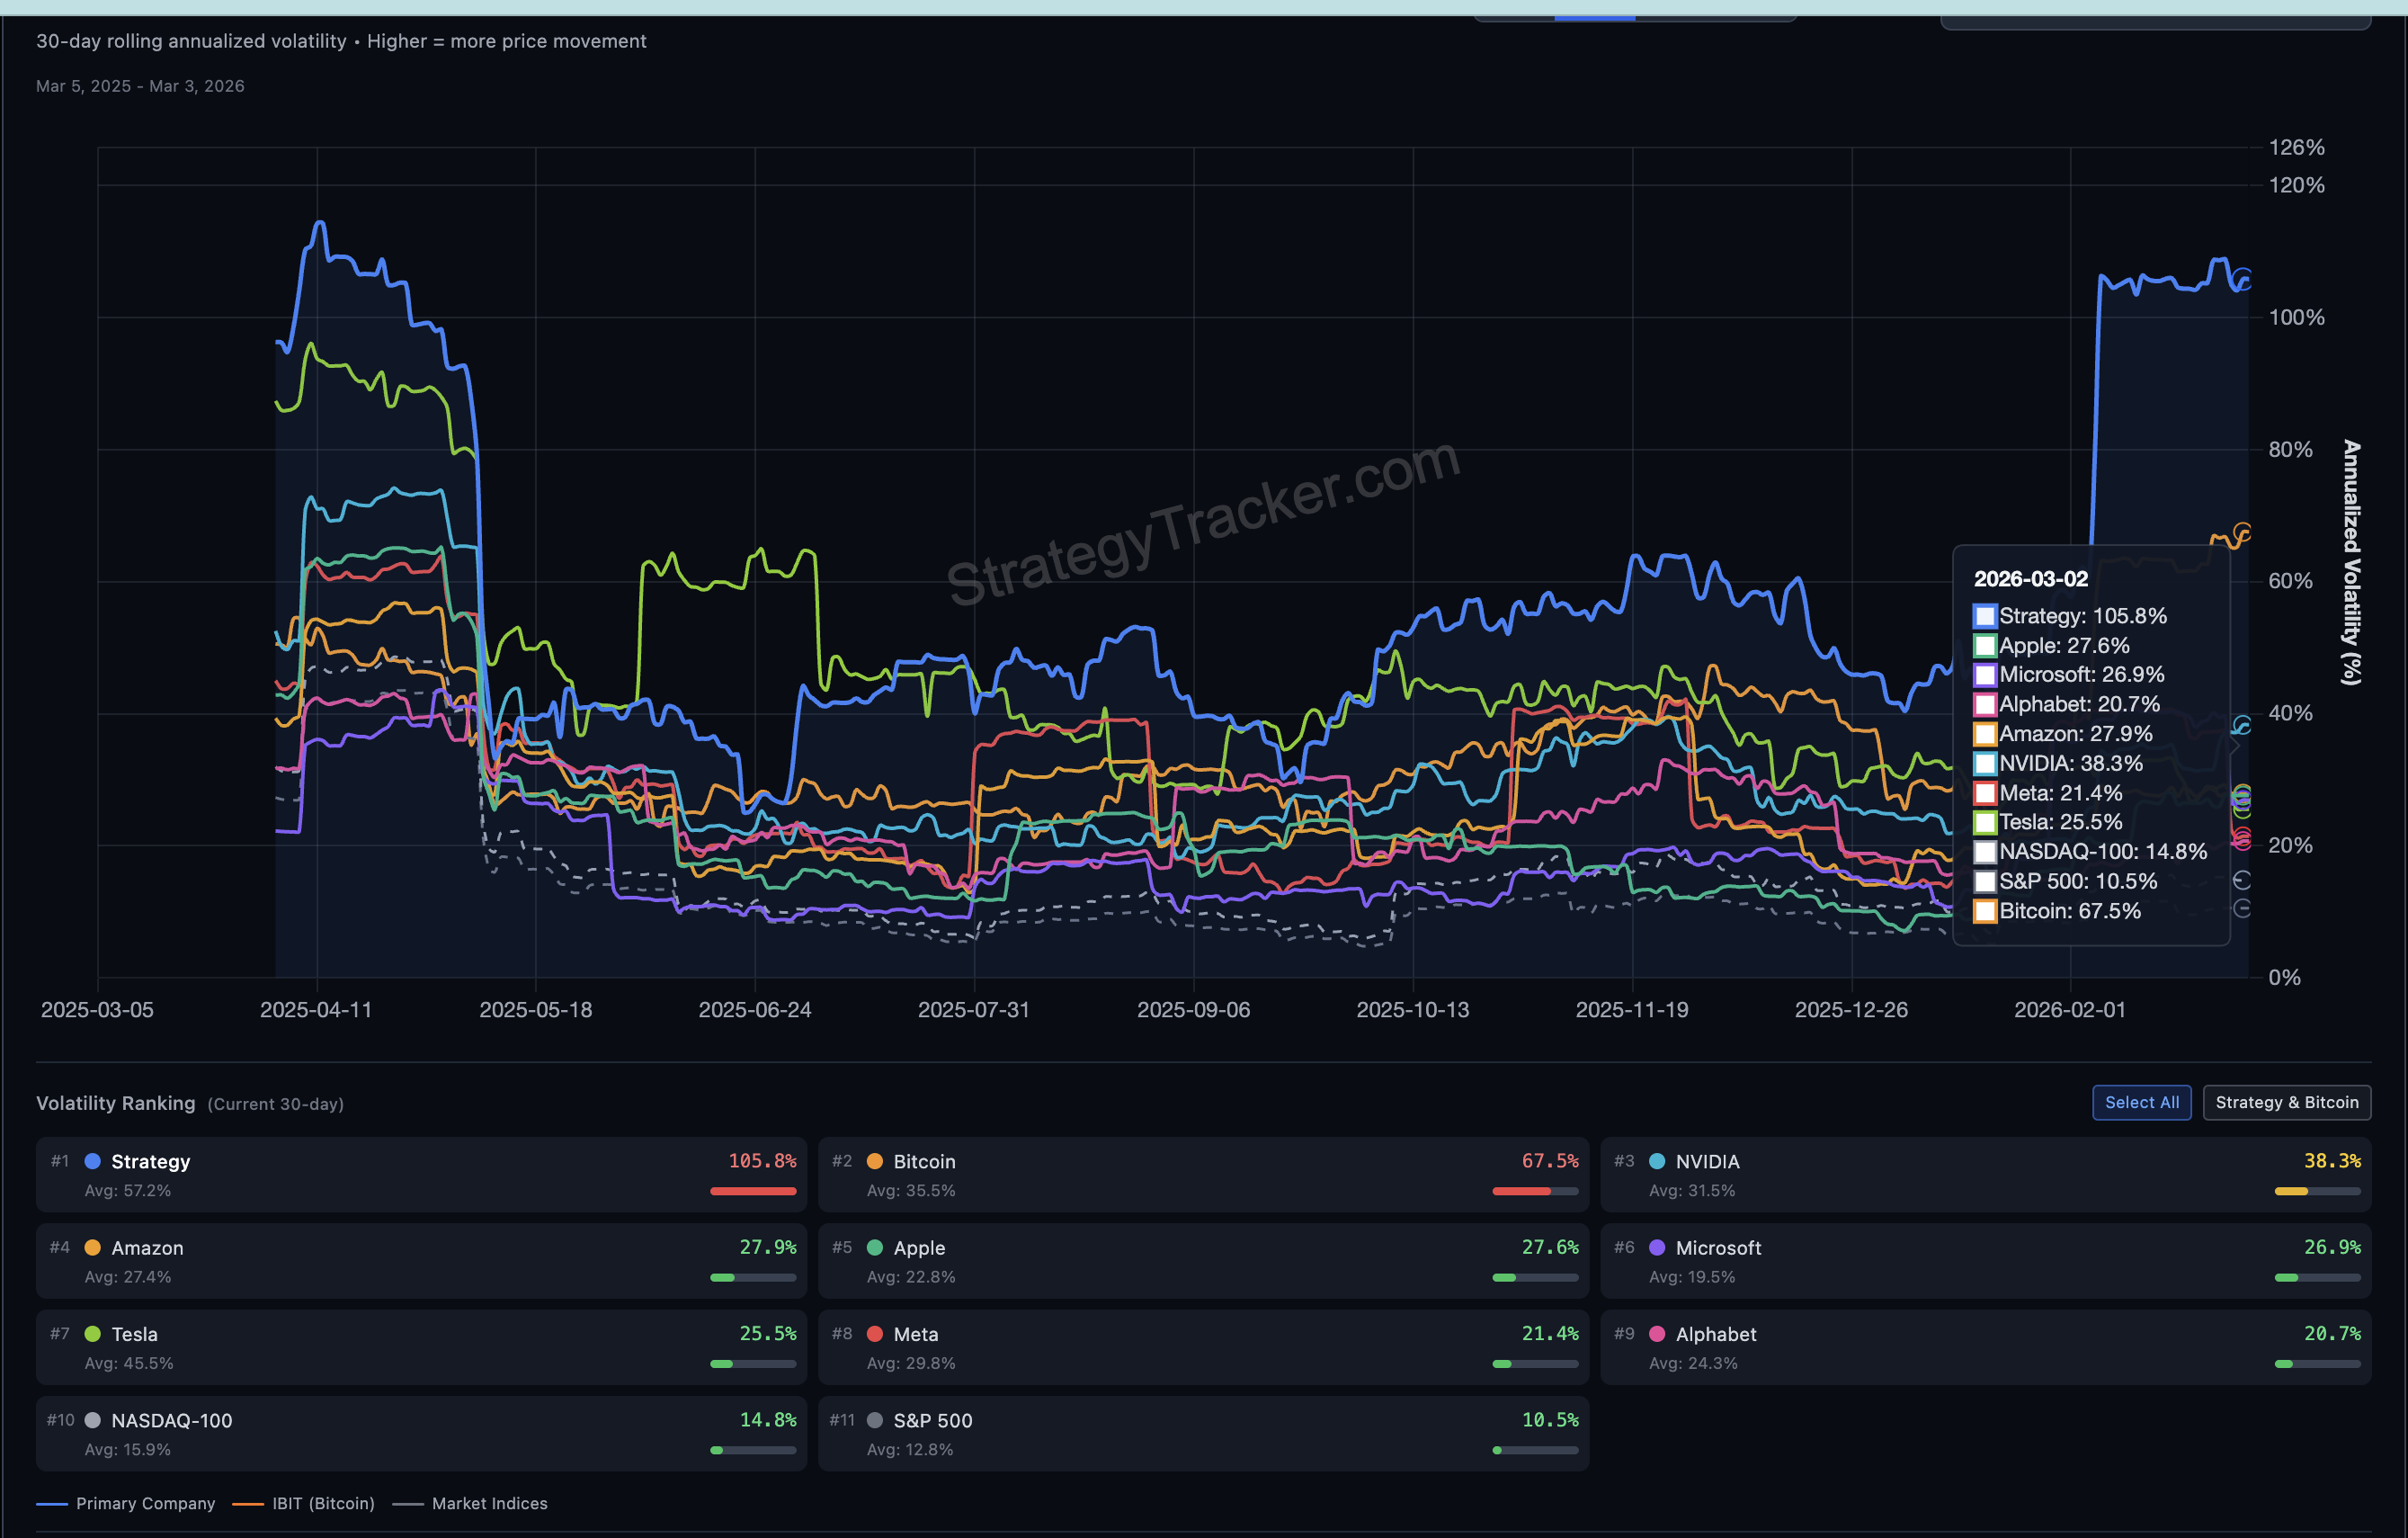
Higher volatility, of course, means sharper price swings, wider spreads, and a greater risk of sudden liquidations-especially when the trading floor is as deserted as a Nabokov novel’s sense of humor. All thanks to fading participation, the financial equivalent of a party where everyone has left but the host.
Weekly average traded value has shriveled 67% from its $7.8 billion peak in early February, now languishing at $2.59 billion. The monthly average, a mere $3.30 billion, marks a 58% decline. Rising volatility paired with collapsing volume means fewer shareholders are orchestrating larger swings, rendering moves as reliable as a narrator in a Nabokov tale.
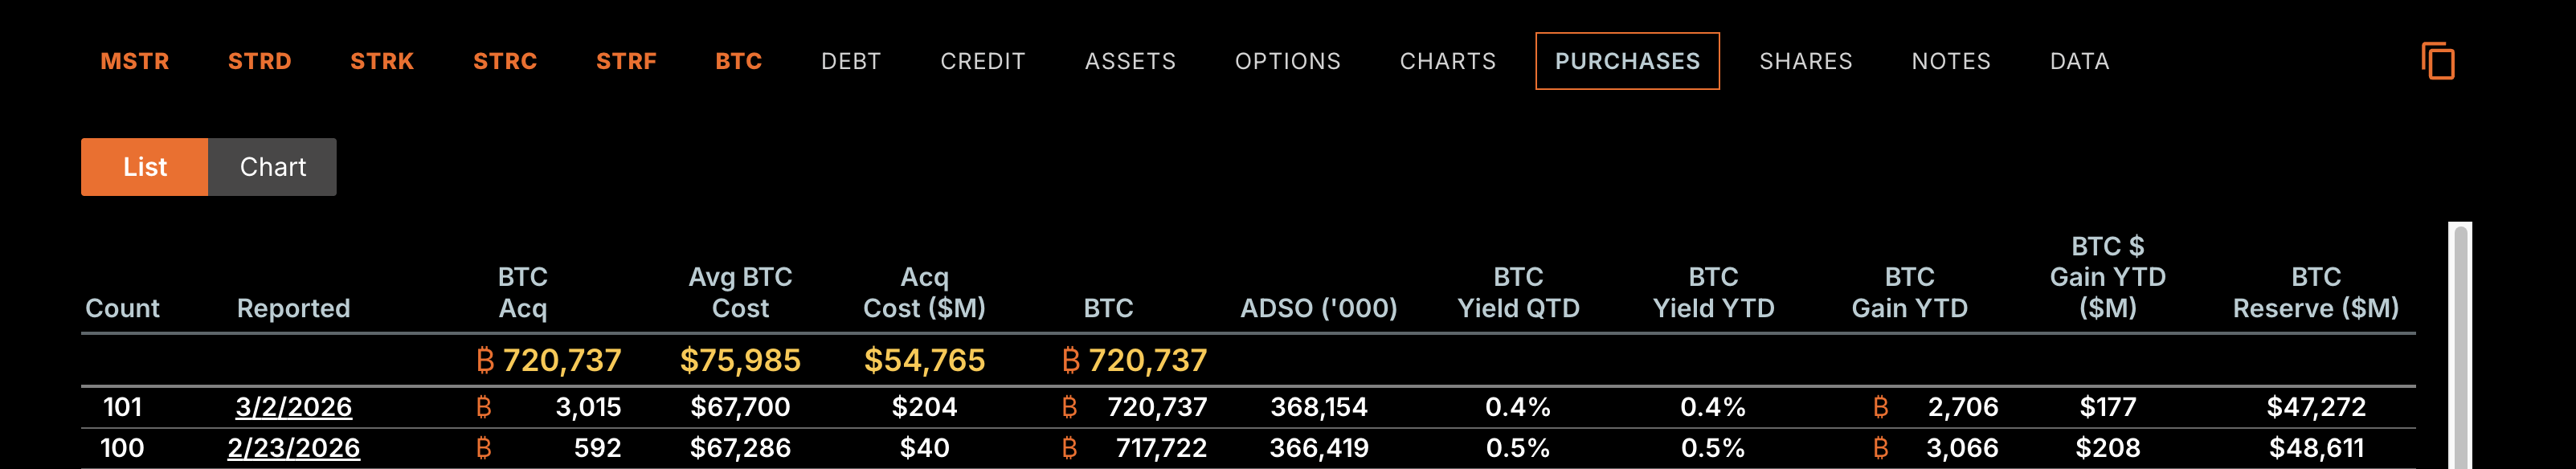
Amid this chaos, Strategy Inc announced its 101st Bitcoin purchase on March 2. Its holdings now stand at 720,737 BTC, acquired at an average cost of $75,985. With Bitcoin hovering near $67,000, the position is underwater by roughly $6-7 billion. Yet, the company persists in buying, a financial Sisyphus pushing its boulder uphill. The market, unmoved, offers no applause.
The indicators, those subterranean whispers, suggest Monday’s bounce was but a fleeting interlude. The bearishness, like a persistent cough, may well continue.
Momentum, Money Flow, and the Fading of Conviction
The Chaikin Money Flow (CMF) reading at 0.06 connects the 101st buy to the broader tableau. CMF, often a proxy for institutional buying, showed no sizable uptick despite Strategy’s addition of 3,015 BTC. It has been trending lower since mid-February, in lockstep with the price. While the net CMF move appears bullish, its failure to achieve a higher high against the MSTR stock price betrays a growing weakness-a financial limp, if you will.
Should CMF cross below zero (it has not yet), it would confirm that net money is fleeing MSTR, aligning neatly with the 67% collapse in weekly traded value.
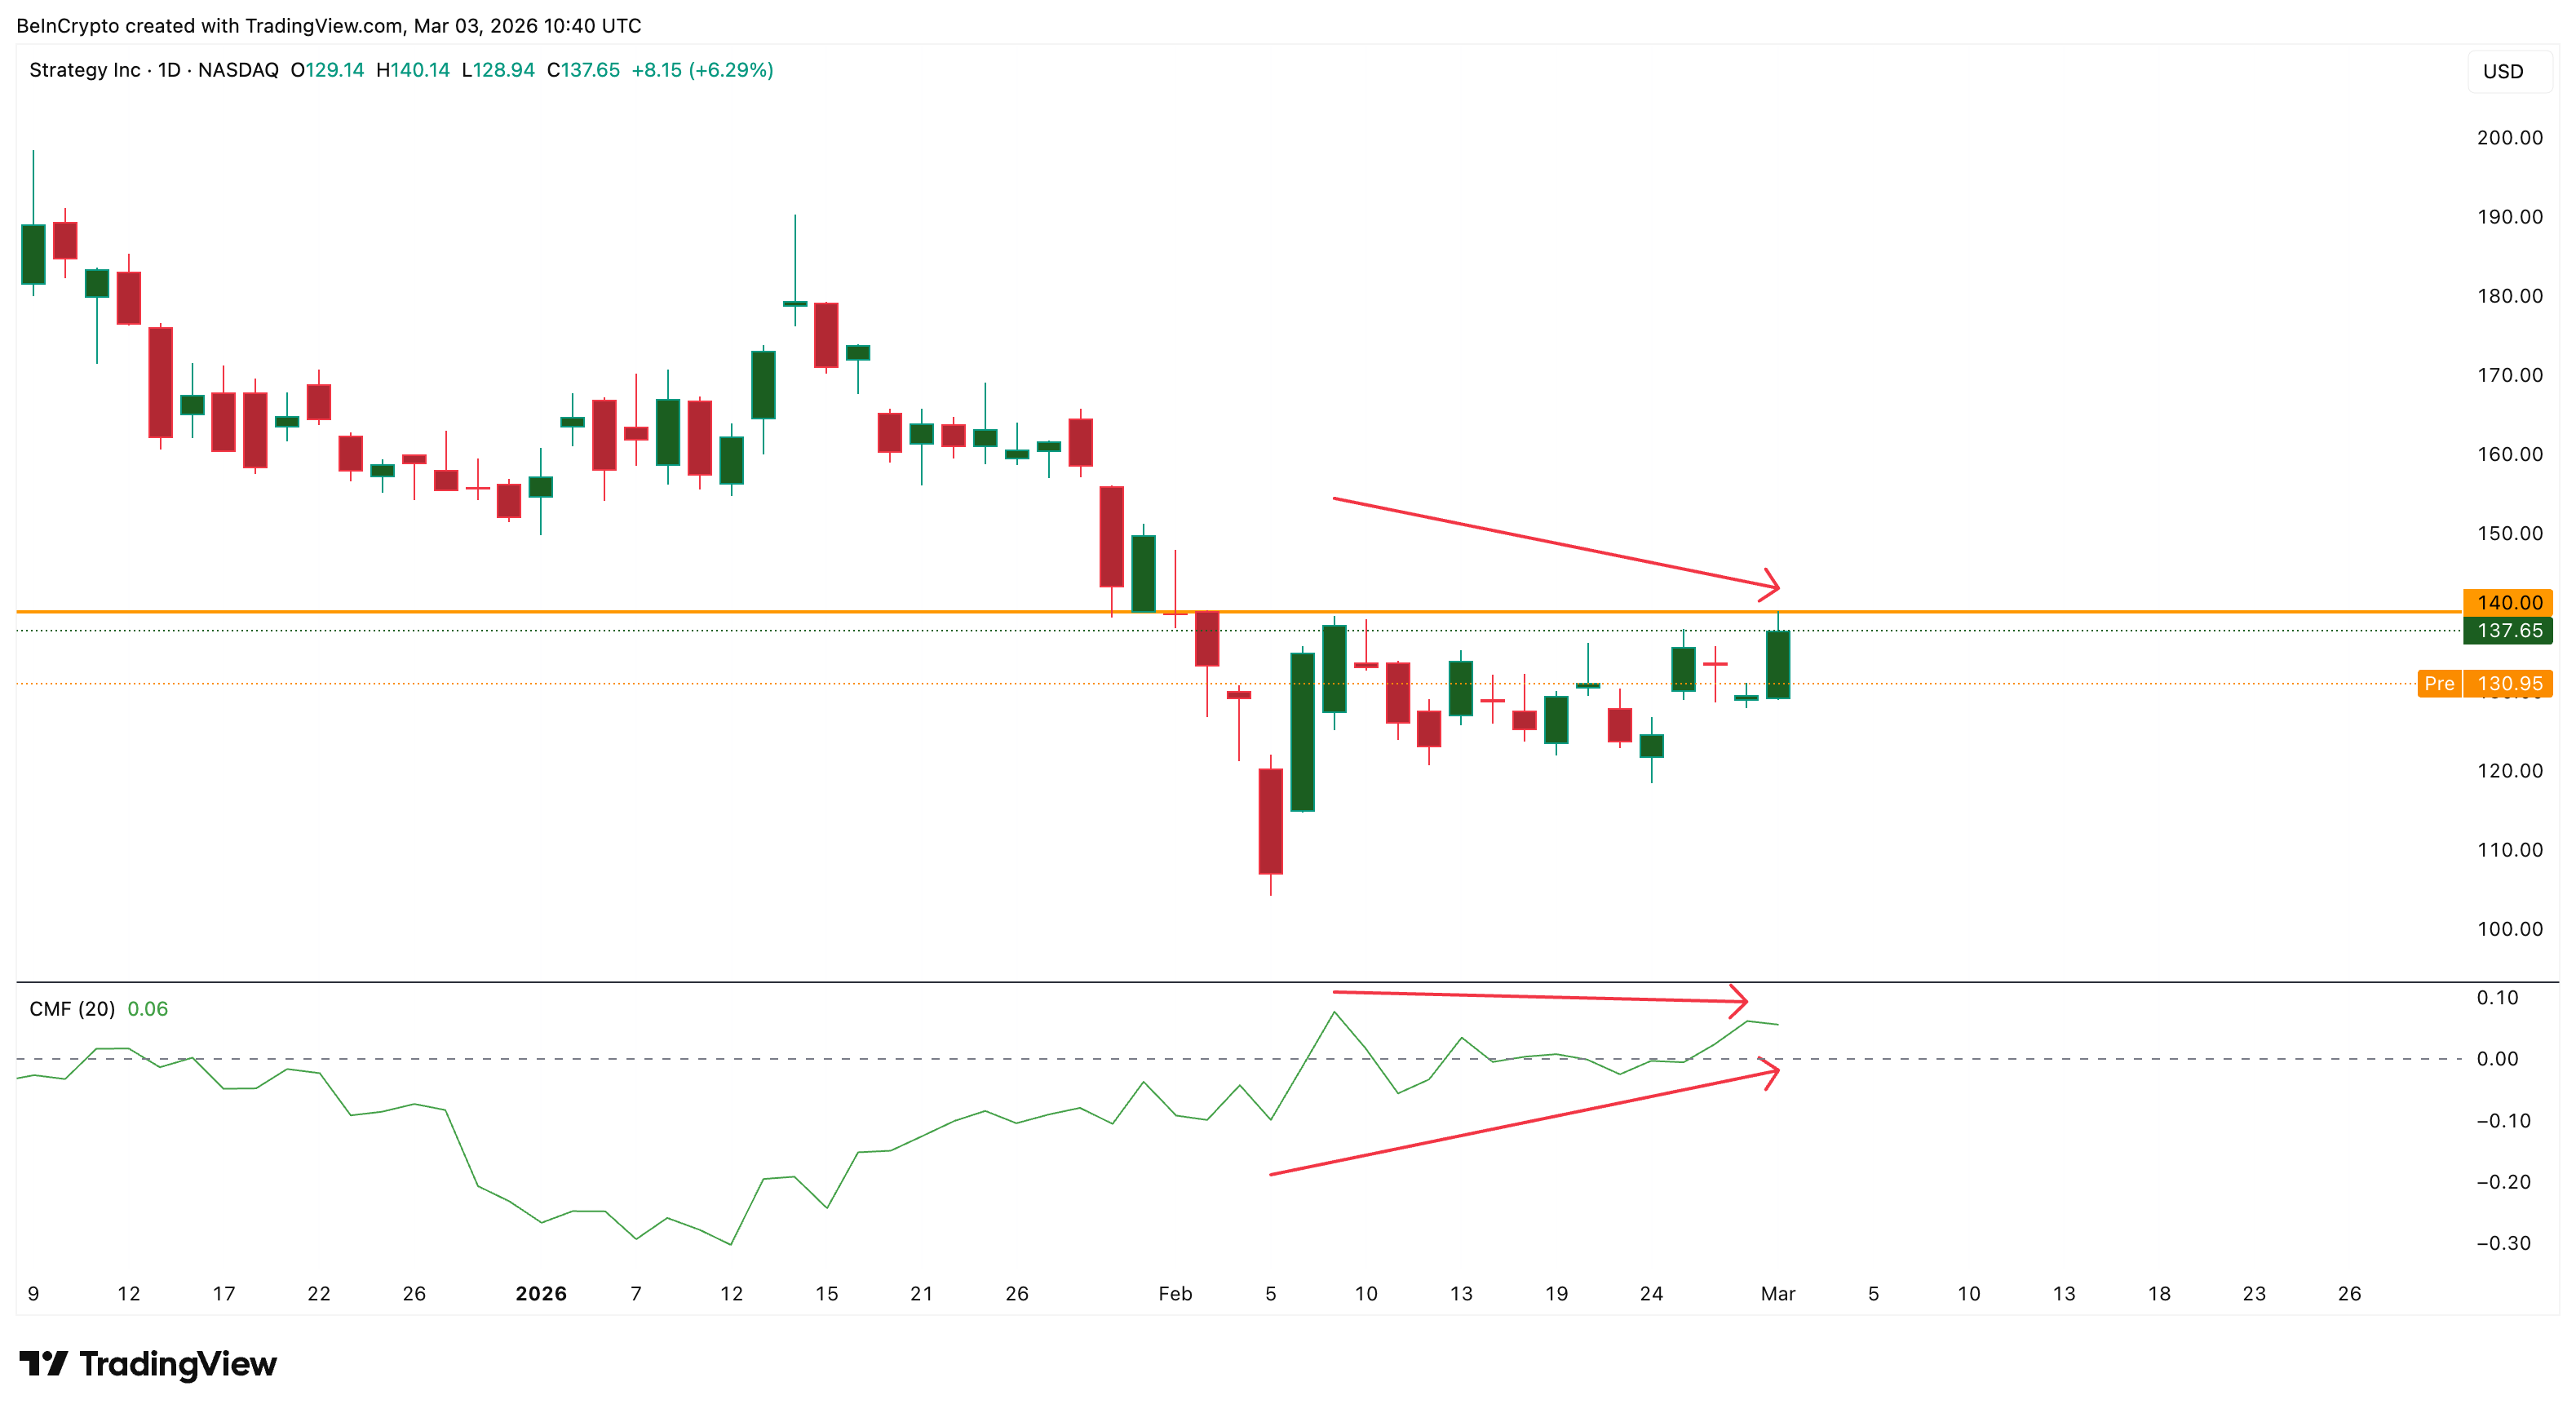
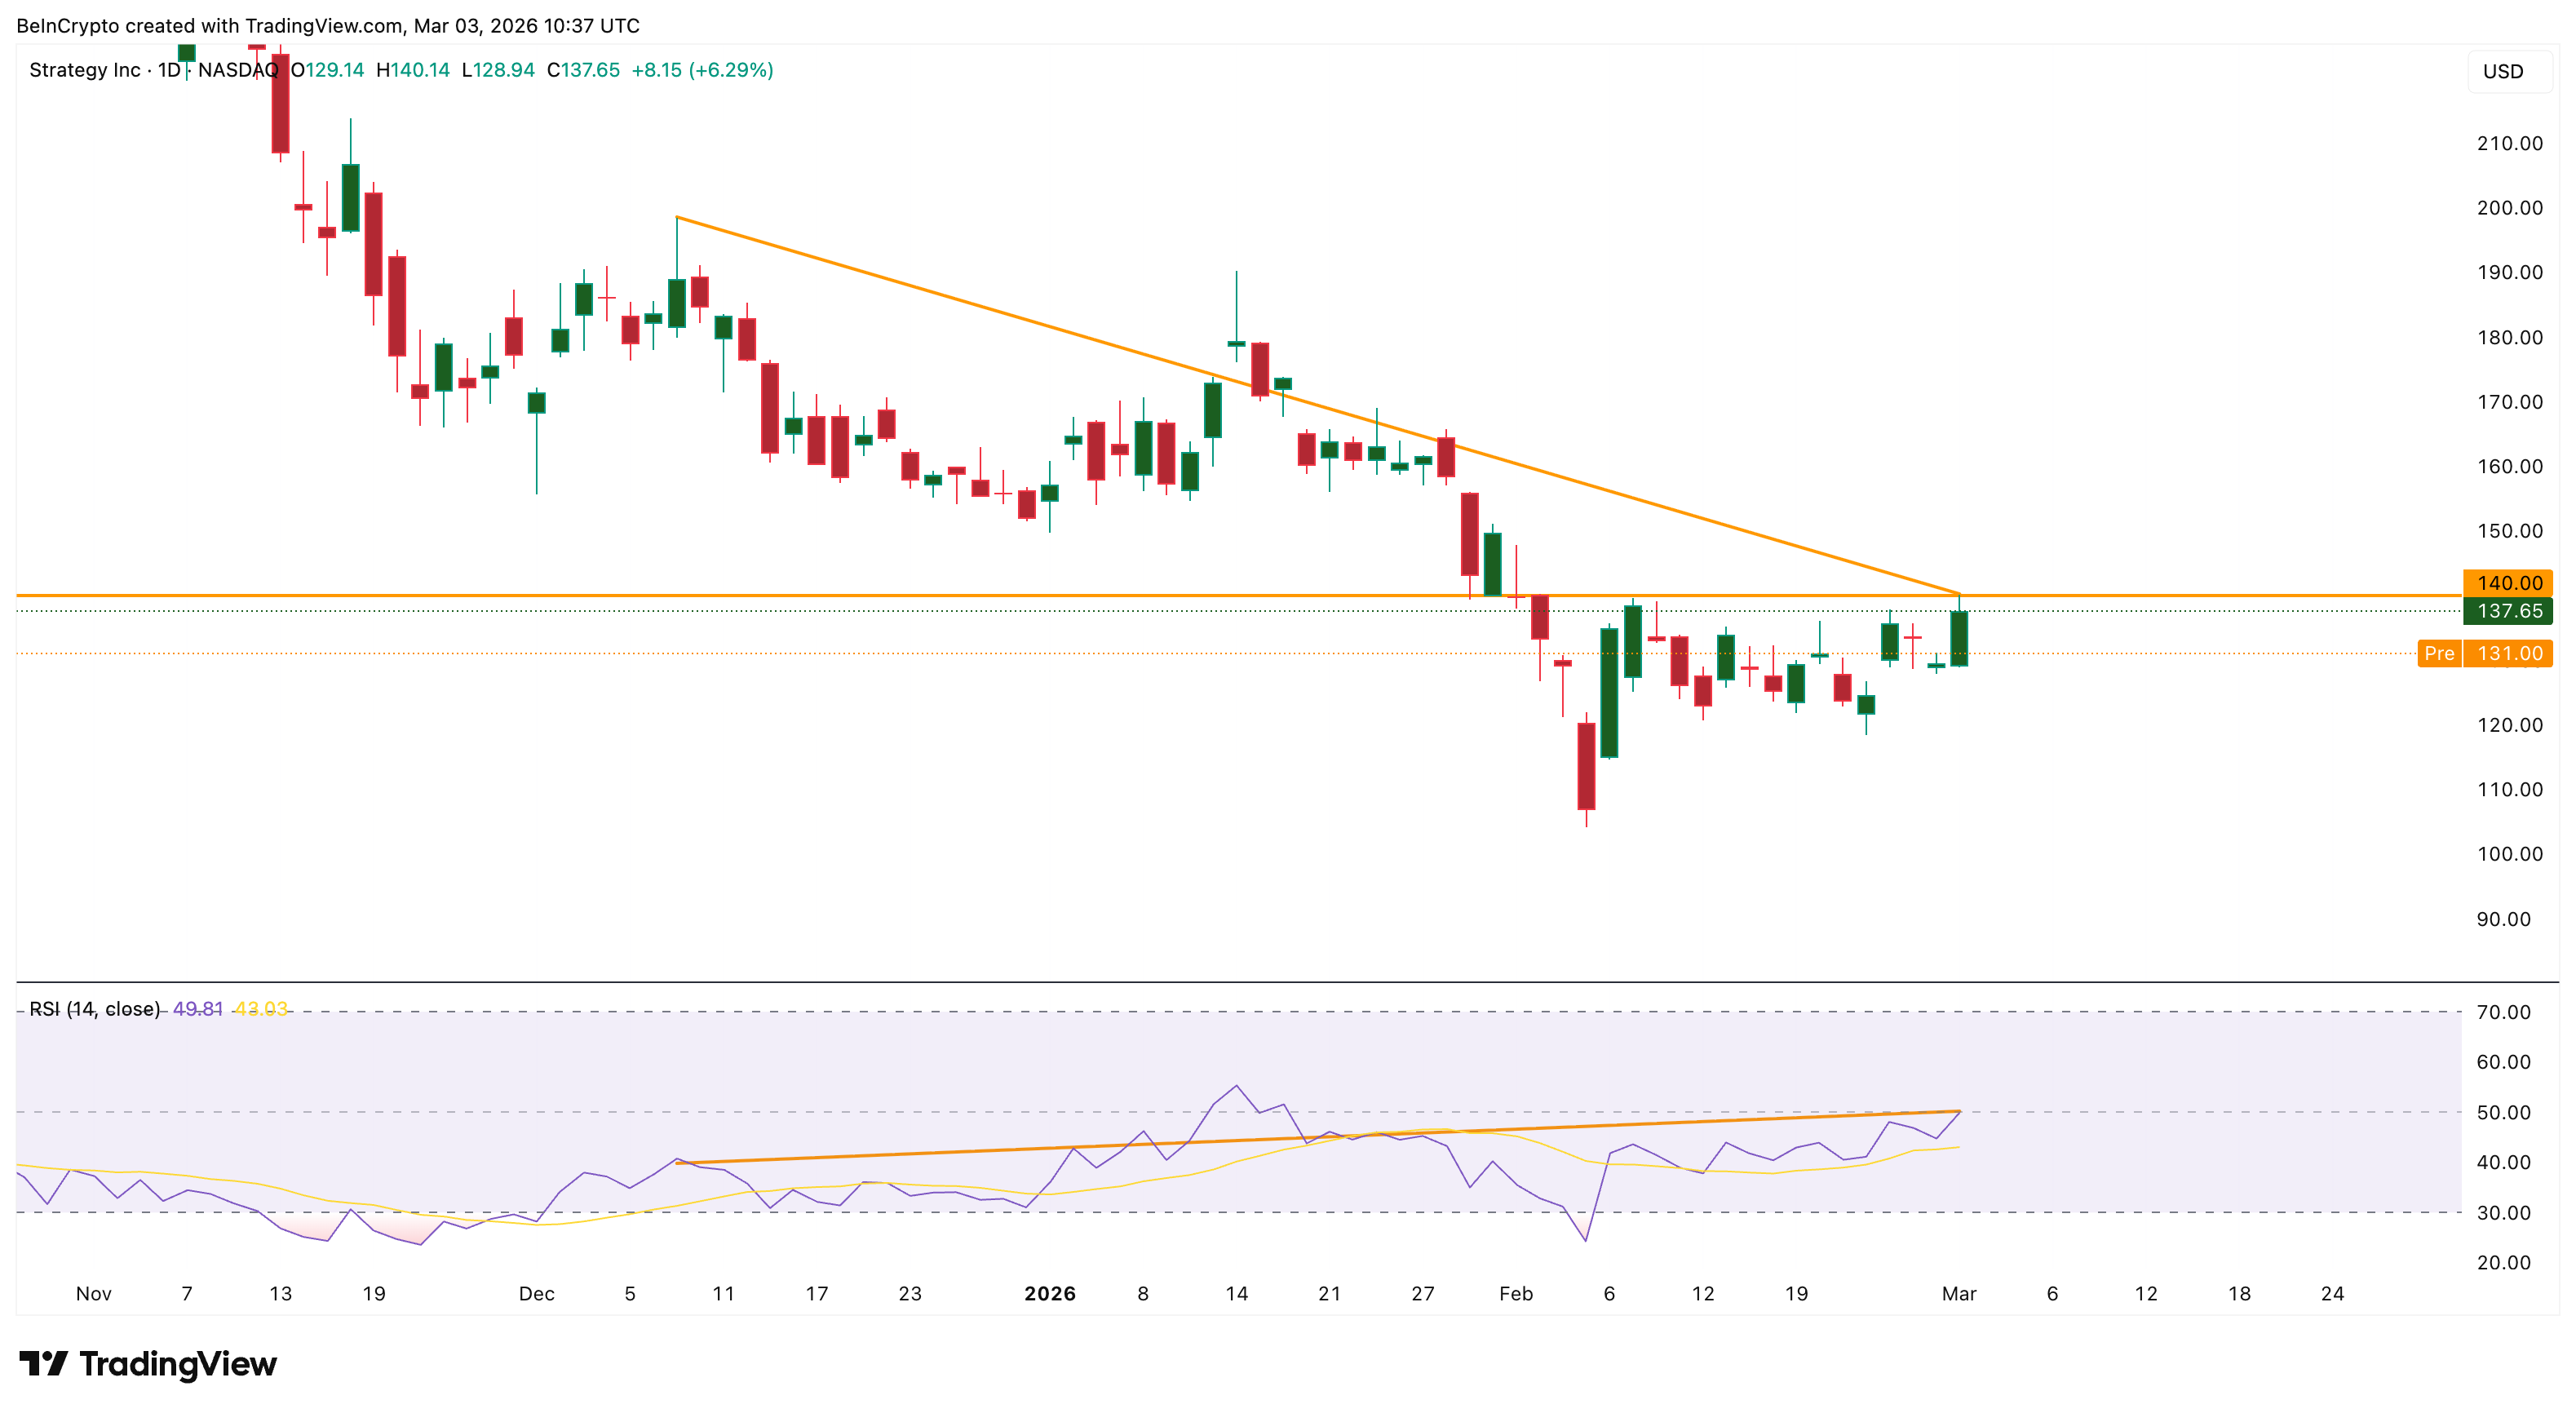
The daily Relative Strength Index (RSI), that trusty momentum indicator, reinforces this fading vigor. Between December 9 and March 2, MSTR’s price formed lower highs, while RSI printed higher highs-a hidden bearish divergence that suggests the broader downtrend may resume. A pullback, my dear reader, may be nigh. The weakness is confirmed if the net candle forms under $140.
The pre-market price, ever the harbinger, further validates this risk.
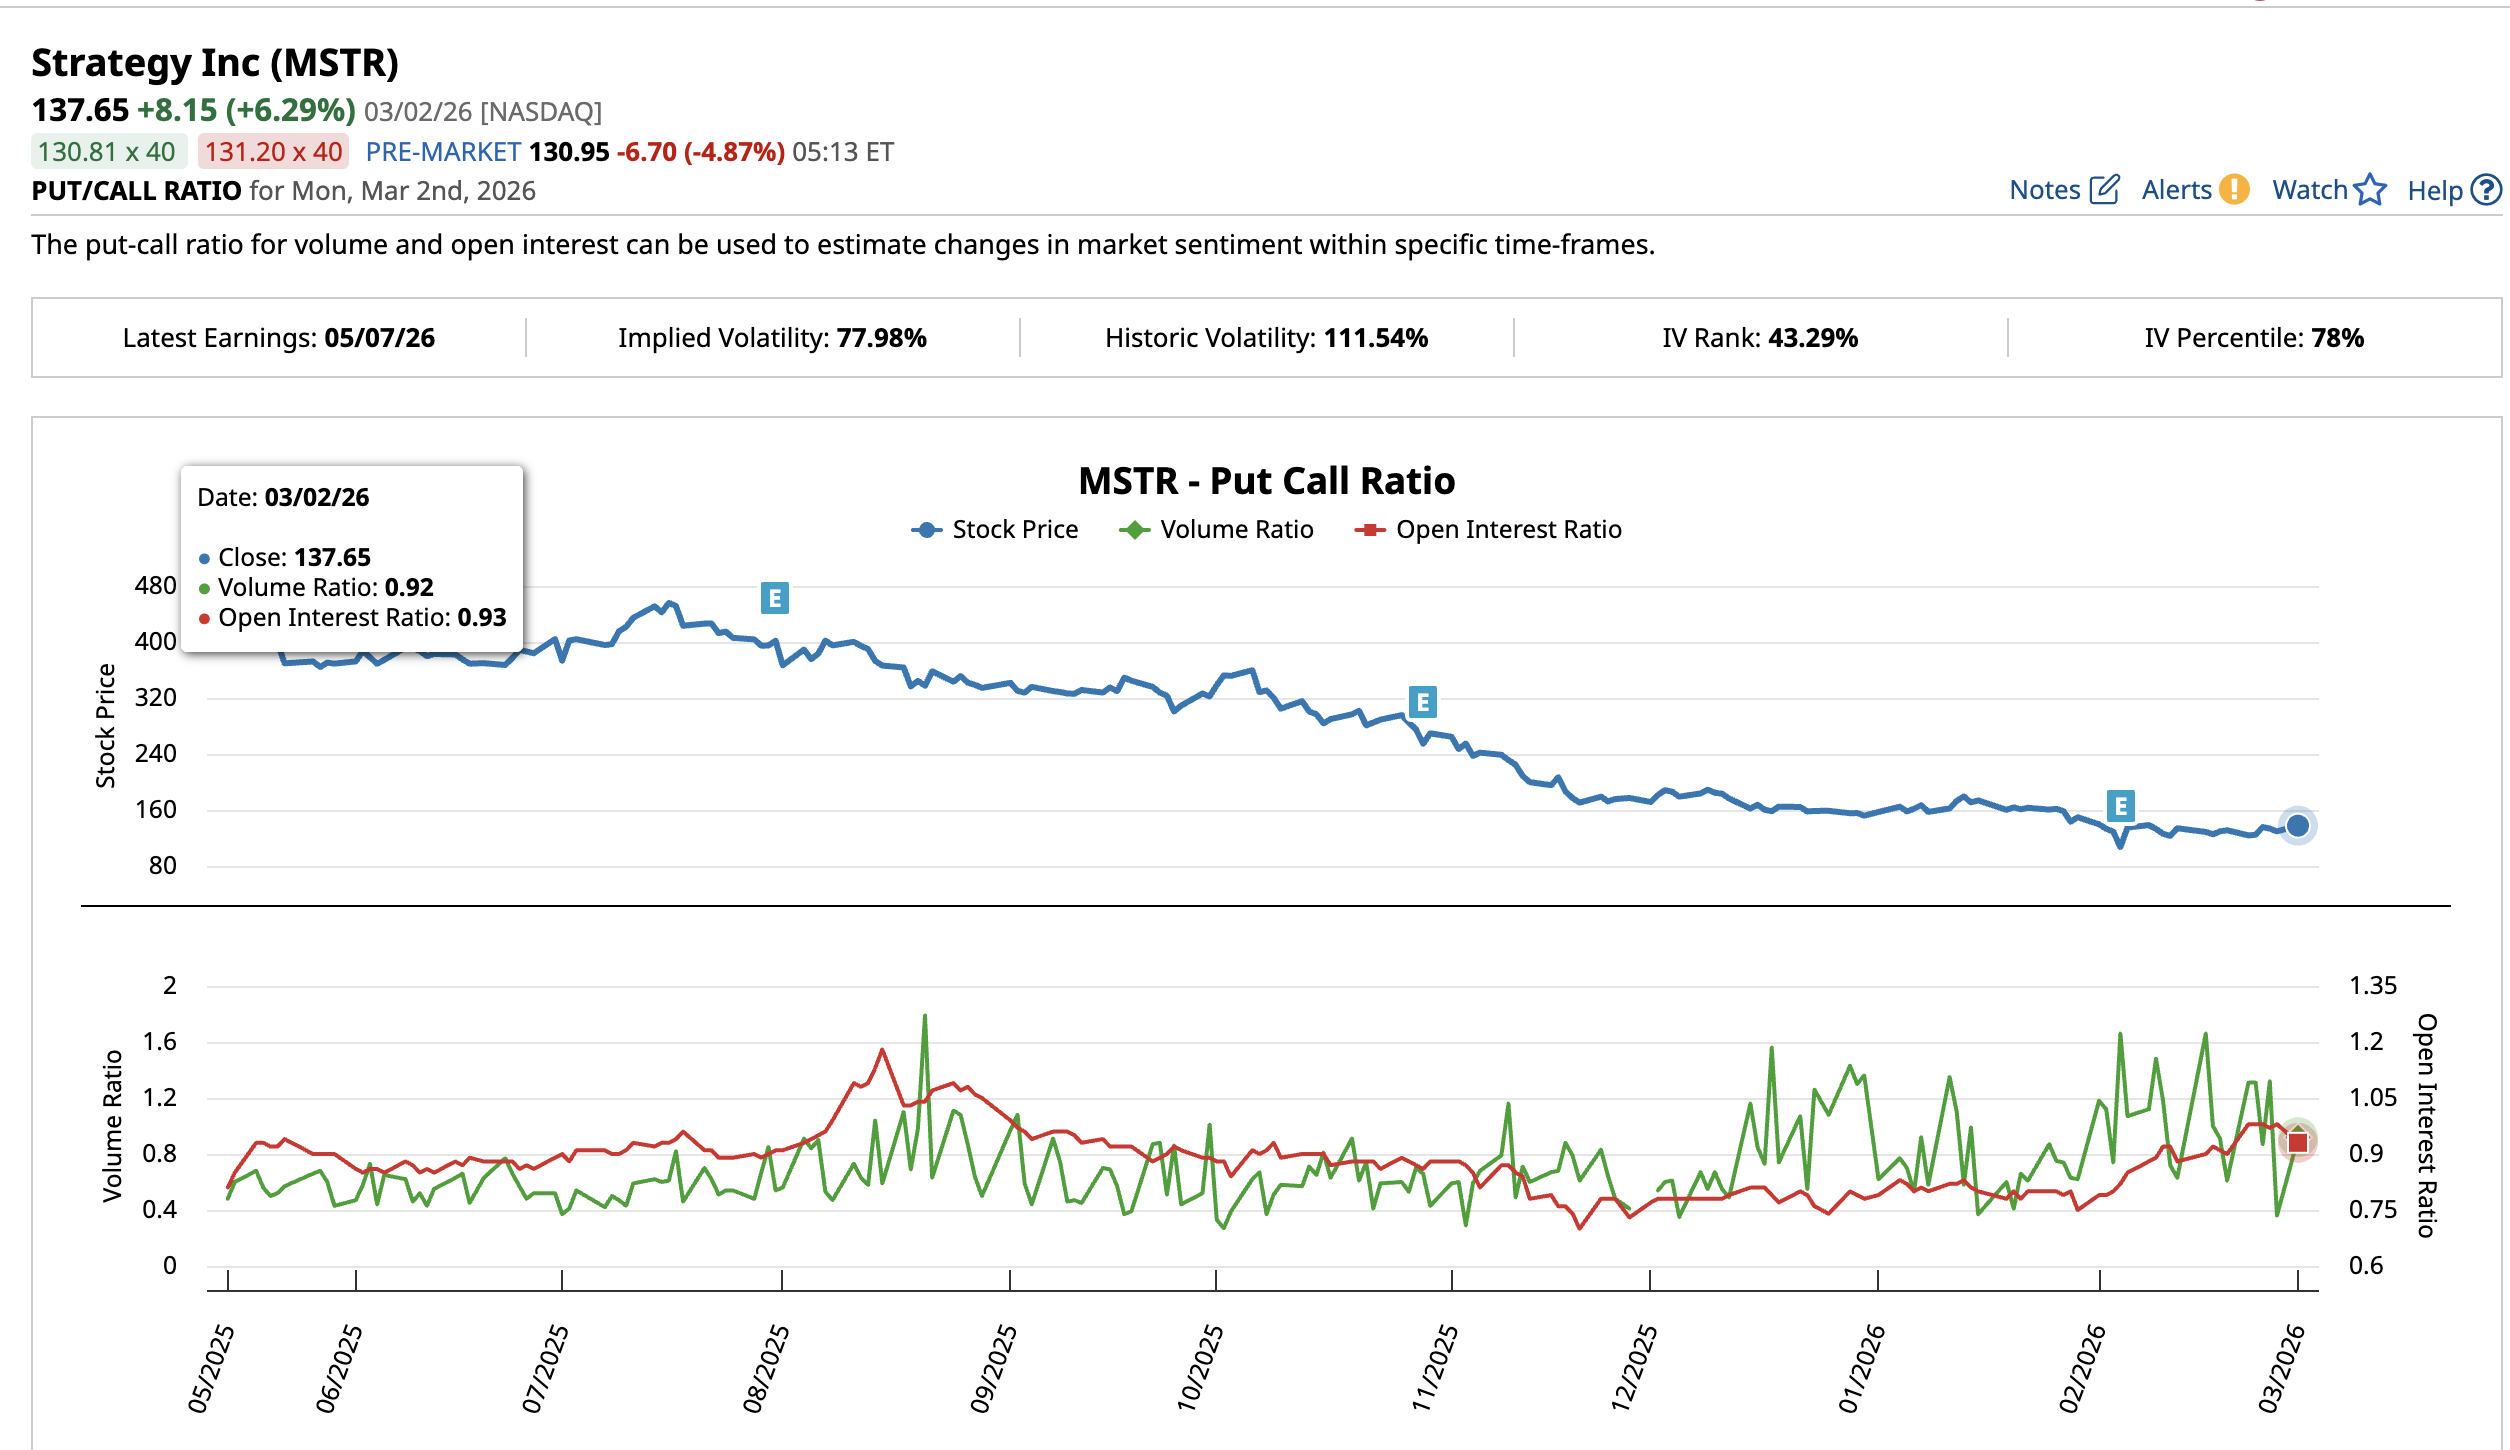
Options data, that cryptic oracle, tells a similar tale. The put/call volume ratio at 0.92 and the open interest ratio at 0.93 are near neutral-roughly equal money flowing into bullish calls and bearish puts. February’s panic has dissipated, but no strong conviction has taken its place. Implied volatility at 77.98% trails the 105.8% realized volatility, suggesting the market anticipates calmer days ahead. Perhaps if BTC remains range-bound.
Craving more of this financial farce? Sign up for Editor Harsh Notariya’s Daily Crypto Newsletter here.
Yet, MSTR’s price action has been uncooperative. Traders, those fickle creatures, sit on the sidelines, making no aggressive bets. This ties back to the declining participation visible in traded volume and even CMF-a financial shrug, if ever there was one.
MicroStrategy’s Fate: $124, the Financial Rubicon
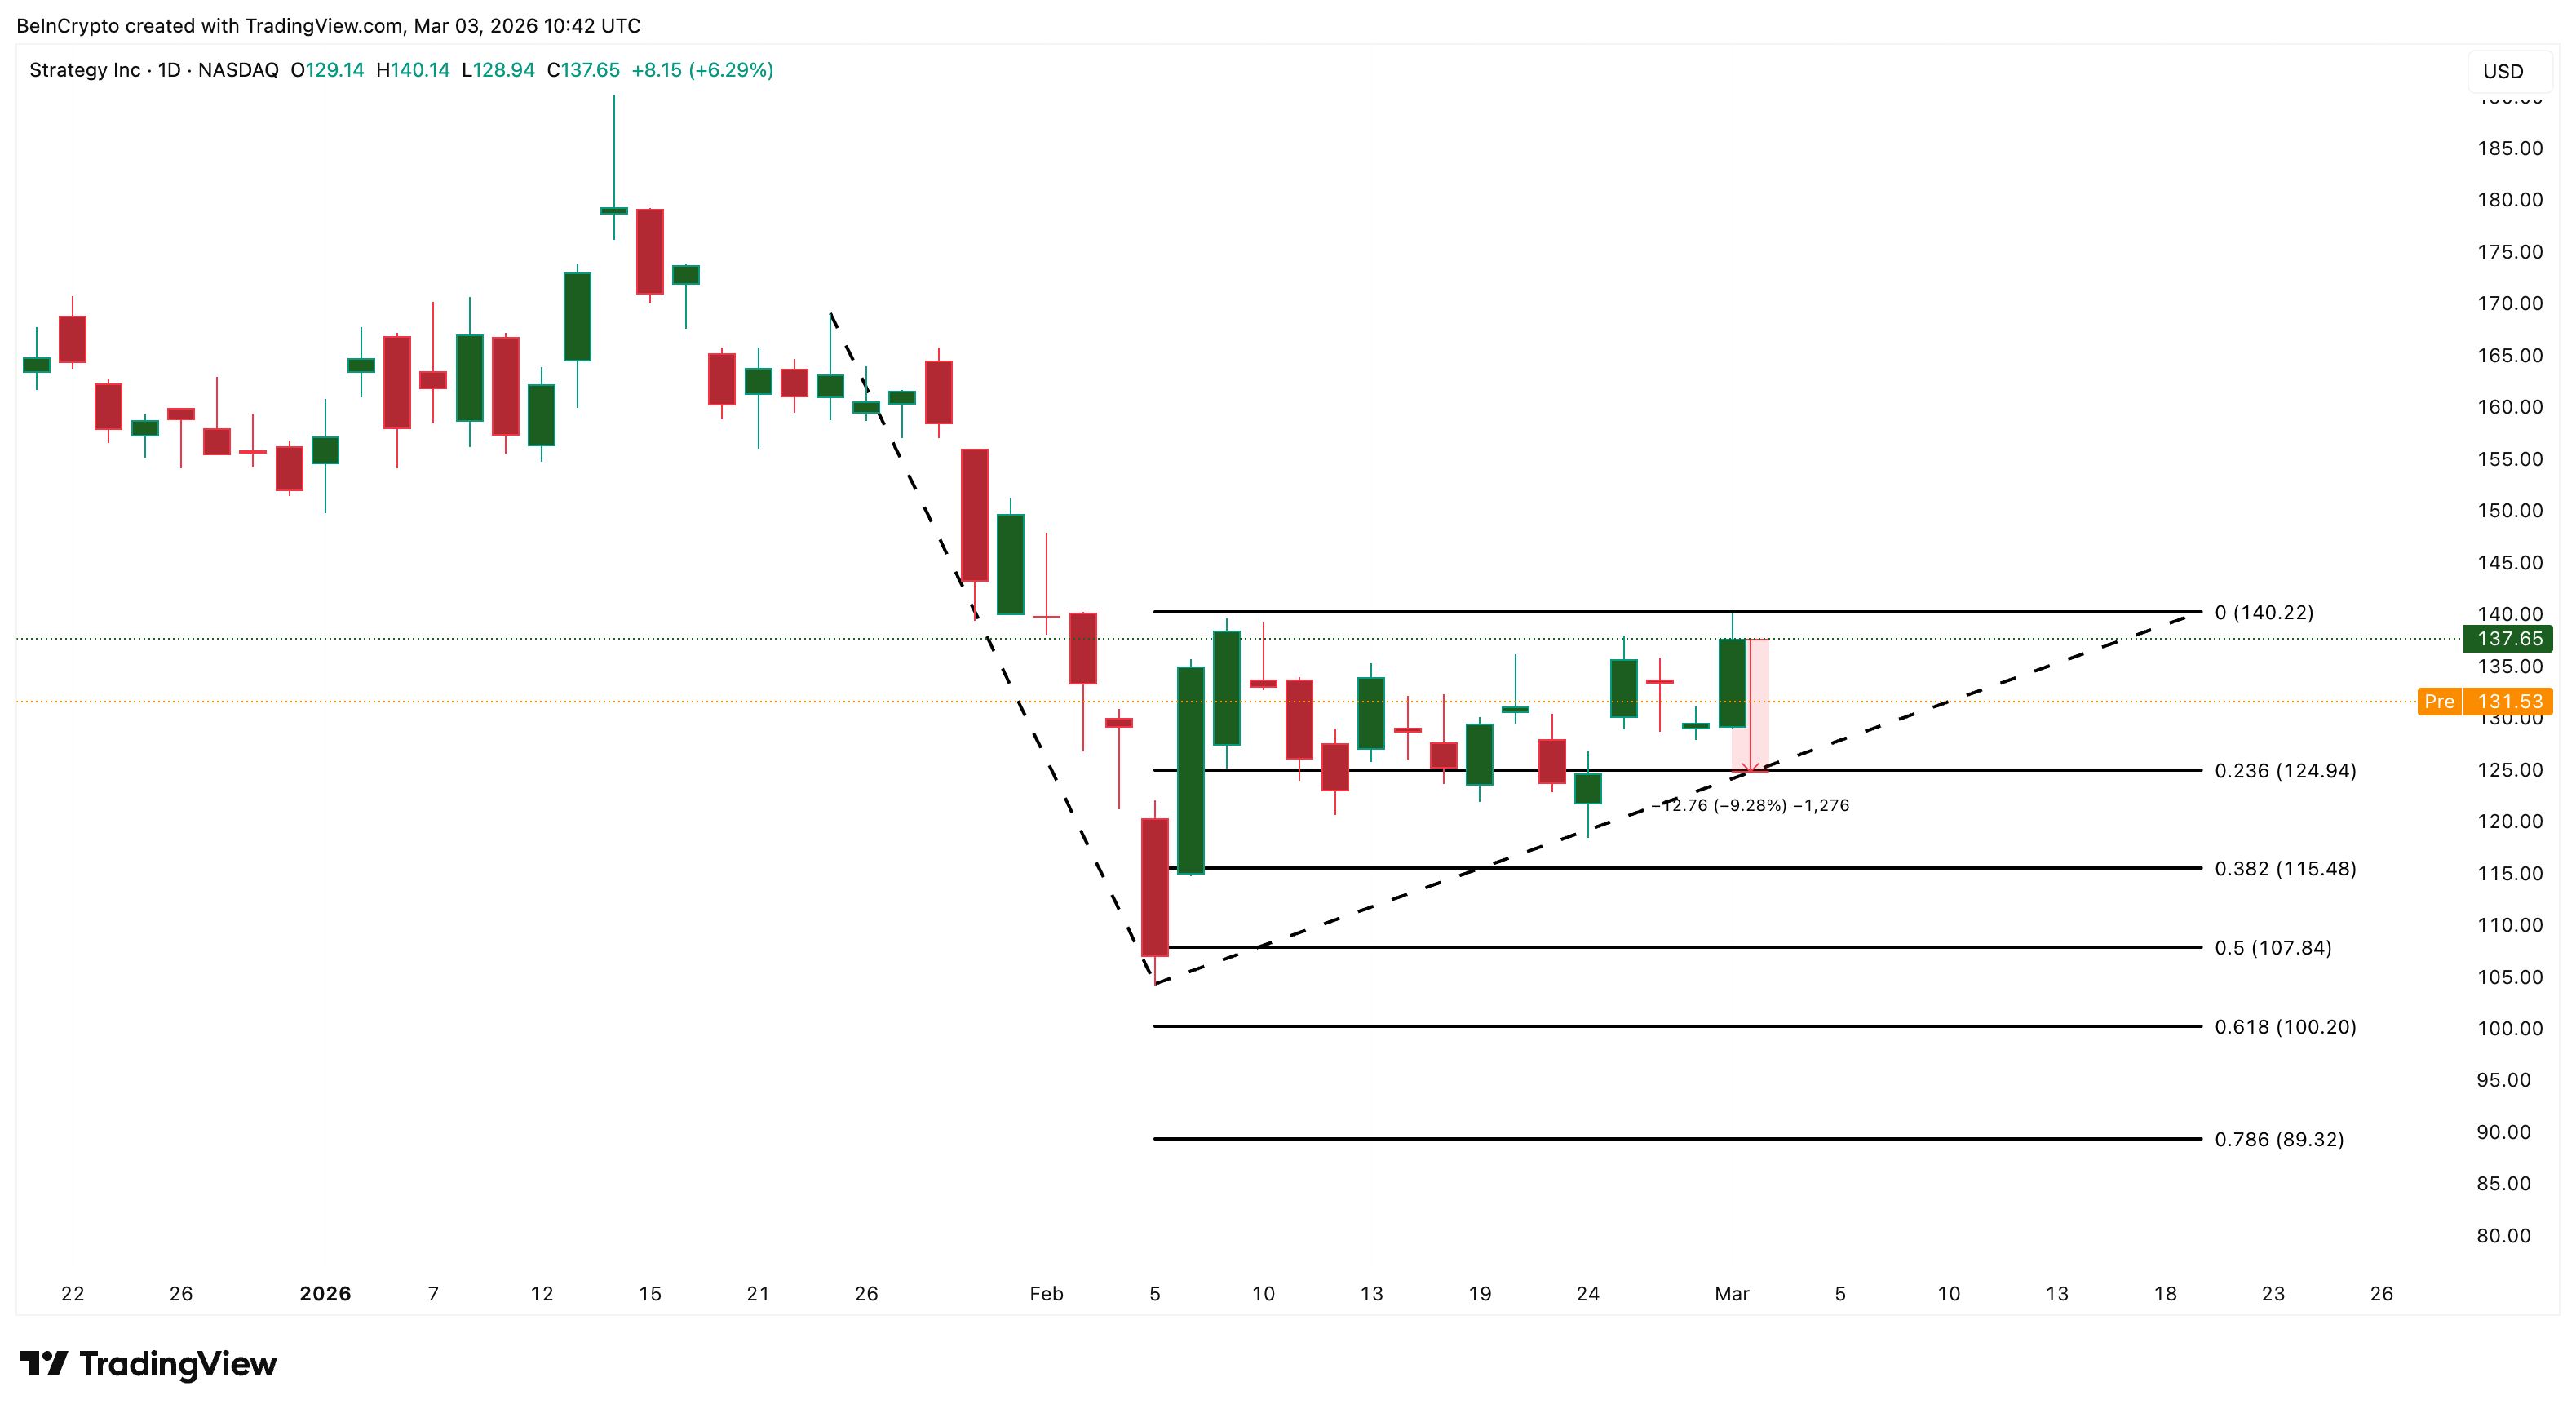
MSTR has been trapped between $140 and $124 for nearly four weeks, save for a few volatile escapades. Monday’s rally hit resistance at $140 and reversed. The floor at $124, the 0.236 Fibonacci level, is the key to this financial drama-a nearly 10% dip from Monday’s close.
The weight of evidence-hidden bearish RSI divergence, weakening CMF, neutral options positioning, macro pressure, and sharply reduced volume-tilts toward a downside move. A daily close below $124 opens the gates to $115, then $107, and finally $100.
Still, one upside catalyst remains. If Bitcoin reclaims and holds above $69,000, a decisive close above $140 on strong volume would invalidate the bearishness and trigger a sharp repositioning. Given MSTR’s amplified volatility, such a move could extend higher-a financial crescendo, if you will.
Until then, $124 is the line in the sand. Hold it, and the range continues. Lose it, and the correction likely accelerates. The stage is set, the players are in place, and the farce unfolds.
Read More
- EUR PHP PREDICTION
- USD JPY PREDICTION
- USD MYR PREDICTION
- EUR USD PREDICTION
- EUR RUB PREDICTION
- BTC PREDICTION. BTC cryptocurrency
- ETH Price Stalls at $3K Amid $19M ETF Exodus!
- SUI’s Surprising Rise: The Saga of a Blockchain That Smirks at the Rest
- Gold Rate Forecast
- EUR IDR PREDICTION
2026-03-03 19:11