Once languishing under the weight of relentless selling through late September, the once-dominant Optimism token finds itself back in the spotlight. Why? Because it crossed a line-literally-above the oh-so-critical $0.72 mark. But before anyone starts uncorking champagne, let’s remember: we’ve seen this before, haven’t we? A little rebound, a flicker of hope, and then… well, let’s not get ahead of ourselves.
Short-Term Recovery Supported by Open Interest
Take a gander at the recent 1-hour chart-after sinking to a pitiful $0.63 earlier this week, buyers jumped in like it was a Black Friday sale, bidding the price back up. Higher lows, higher highs, all the classic signs of a classic rally. But then again, what’s a rally without a price drop to make it interesting?
At the time of writing, OP has sauntered its way back to the $0.70 mark, a psychological milestone that might just stick around as support if demand is persistent. The suspense is unbearable, isn’t it?
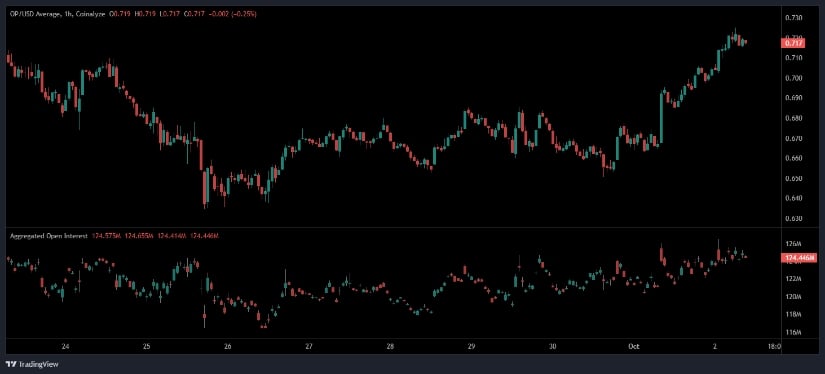
And don’t overlook the open interest-stabilizing around $124.4 million after a rather, shall we say, “exciting” period of volatility. Traders are starting to show a little more commitment. No sudden, erratic spikes in OI, which means the price rise is likely being driven by real buyers, not just gamblers with leverage. A good sign, or is it? You know how the markets like to surprise us.
Metrics Highlight Uptick in Market Participation
Optimism, the token of the moment, is now trading at $0.72, a humble 7.22% uptick in the last 24 hours. A solid performance, sure, but it’s still a far cry from the glory days of its 2025 highs. It has a market cap of $1.28 billion, with daily trading volume breezing past $165 million. So, retail and institutional traders are back, or at least showing up for the party. That’s something, right?
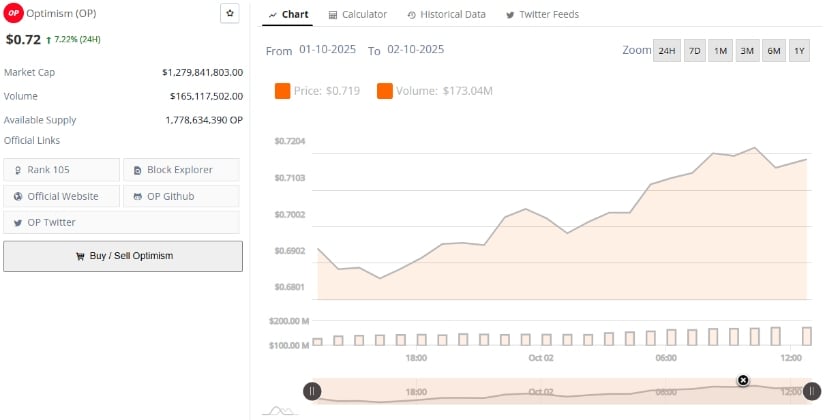
With 1.77 billion tokens floating around in the market, Optimism ranks in the top 110 crypto assets by market cap. Sure, it’s making a comeback, but let’s not pretend it doesn’t have a steep mountain to climb before those bulls really get the upper hand.
Technical Indicators Signal Mixed Momentum
A closer look at the technicals? Well, let’s just say the momentum here is more cautious than a cat near a dog. On the daily chart, OP is hovering just around $0.7162-nothing to write home about. Sure, it’s up 1.59% on the day, but don’t start buying your “Optimism is Back” t-shirts just yet.
The Chaikin Money Flow (CMF) sits at a not-so-promising -0.10. Translation: more money’s been leaving than coming in. Sounds like a classic distribution, rather than accumulation. In other words, folks, it’s still unclear if this rebound is a genuine recovery or just a flash in the pan.
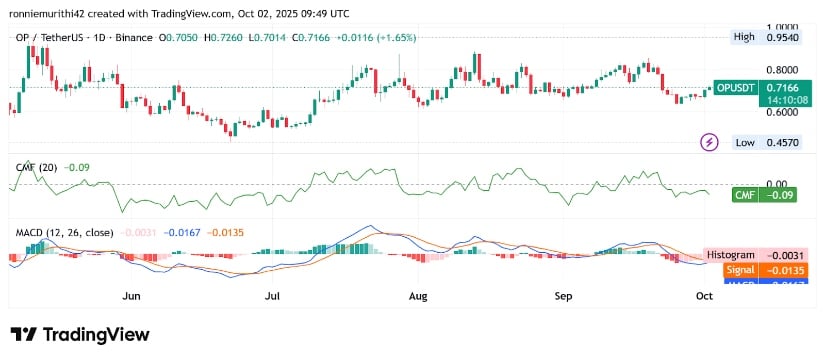
Momentum oscillators? Oh, they’re not exactly painting a picture of unwavering optimism. The MACD line is hanging out at -0.0167, under the signal line at -0.0135, with the histogram giving a delightful negative -0.0032. All that suggests? Bearish vibes still linger. Sure, a bullish crossover might change things, but that’s about as likely as a cat learning to fetch.
Read More
- Brent Oil Forecast
- Silver Rate Forecast
- Gold Rate Forecast
- EUR AUD PREDICTION
- TRX PREDICTION. TRX cryptocurrency
- BlackRock’s ETHB ETF: Staking Your Way to Wealth (or Figment’s Paycheck)
- It’s Official: UK Grants Bitcoin And Crypto Full Legal Asset Status
- Shocking Chainlink Surge! Whale Robins Crawl Back In
- Oh, the Folly! Strategy’s Bitcoin Splurge: $1.57 Billion on Digital Dreams!
- DigiVault: India’s Crypto Custody Circus Arrives Amid Regulatory Tightrope
2025-10-02 23:18