Solana’s price has been struggling to move past the $98 mark. Several negative signals in its price chart and in the derivatives market suggest the price could fall further, potentially dropping below the $80 level.
Summary
- Solana failed to break above the $98 resistance zone, with analysts warning that a breakdown below the $82–$84 support range could trigger a move toward $78.
- Bearish flag and double top patterns emerged across the daily and weekly charts as MACD momentum weakened and RSI lost its upward trend support.
- Solana ETF inflows slowed sharply over recent months while futures open interest dropped from $6.77 billion to $5.45 billion, signaling weakening trader and institutional conviction.
As of May 19, Solana (SOL) was trading around $84, according to crypto.news. It couldn’t maintain a recent price increase that aimed for the $98 level. The token’s value has dropped over 70% from its peak near $295, and its price movement is increasingly restricted within a downward trend.
Solana’s price has recently fallen, and several technical indicators suggest it could drop further, potentially returning to the lowest price it’s reached in recent months.
Looking at the daily price chart, Solana seems to be forming a pattern that often signals further price drops. After a significant fall earlier this year, the price briefly rose, but this increase has been weak and is now trading in a narrow, slightly upward-trending range. This suggests the price is likely to continue falling once it drops below a key support level.
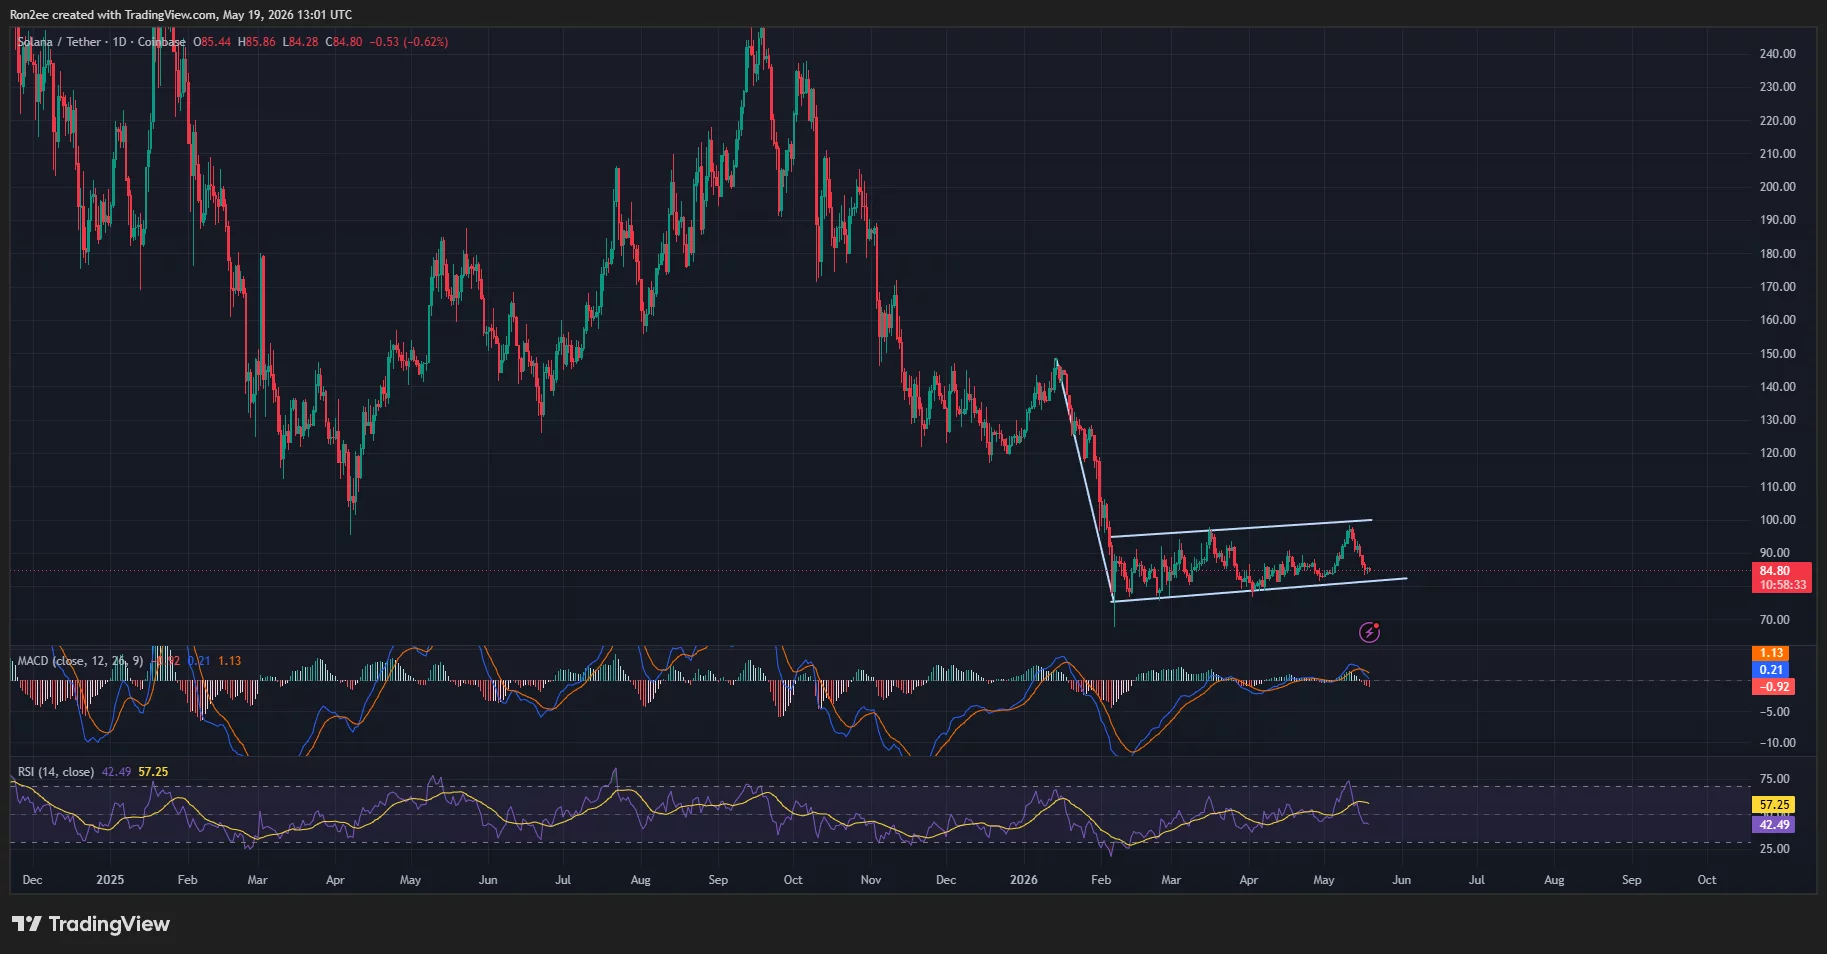
The price recently tried to move above $98, but failed and then decreased. This failure to break through a key resistance level suggests that sellers are still dominating the market, particularly because indicators didn’t support the attempted price increase.
Crypto analyst Ali Martinez recently pointed out on X that Solana’s inability to surpass $98 could lead to a drop back down to around $78.
More and more traders are starting to believe Solana’s price will continue to fall, as the cryptocurrency hasn’t been able to consistently show signs of recovery despite multiple tries over the last few months.
A key worry for those optimistic about the market is the possibility of a ‘double top’ forming on the weekly price chart, which could signal a reversal of the recent upward trend.
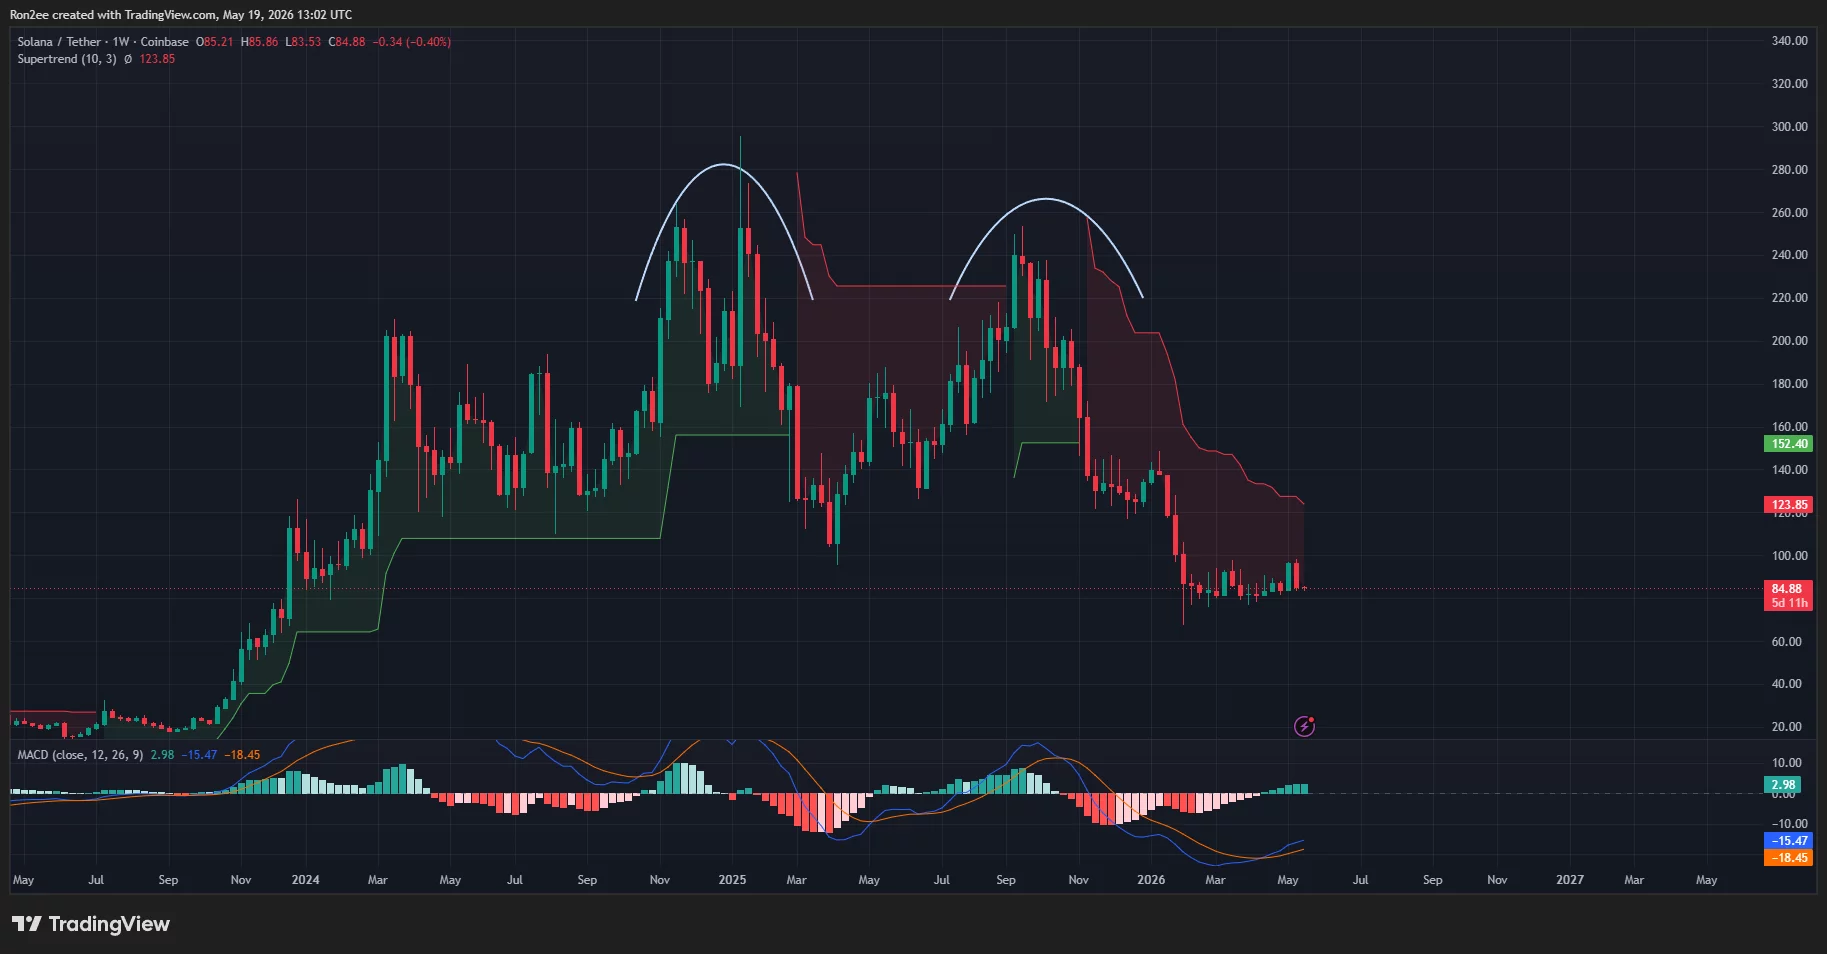
Solana’s price seems to be settling around $250-$260 after it couldn’t break through previous high levels twice. This pattern, called a ‘double top,’ is often seen as a sign that the price might start going down, as it suggests buyers are losing strength after multiple failed attempts to push the price higher.
Solana’s price recently fell below a key support level, signaling a bearish pattern and suggesting a potentially significant price drop in the future.
Currently, the Supertrend indicator continues to signal a downward trend for Solana, with a significant resistance level around $123. As long as Solana stays below that price, it’s likely that the overall market will favor sellers.
Looking at the technical indicators, I’m seeing some concerning signals. The MACD, which helps show momentum, has started to decline again after a brief attempt to turn positive earlier in the month. The histogram, a component of the MACD, is now showing negative values, which suggests that the recent upward momentum is likely weakening.
The Relative Strength Index, a measure of price momentum, has fallen below a recent upward trendline. Currently, the RSI is around 40-45, which suggests that buying interest is decreasing, but the asset isn’t yet considered oversold.
Well-known trader Ted Pillows has cautioned that Solana is currently trading around a critical price point.
According to a recent post on X, Solana’s price needs to stay above $82-$84 to avoid further declines. The analyst noted that losing the upward trend in the Relative Strength Index (RSI) and closing below this price range would be a negative signal.
This warning is particularly important now because Solana is showing a declining trend, consistently reaching lower peaks, and its support levels are becoming less reliable with each test.
Why are Solana’s ETF flows and derivatives metrics turning bearish?
In addition to technical issues, several key economic indicators are starting to show signs of weakening.
One of the clearest warning signs has emerged from Solana ETF flows.
Solana ETFs saw about $58.12 million in new investments last week, but interest from larger institutions has decreased noticeably. The amount of money flowing into these ETFs each month has been dropping for six months straight, going from a high of around $419 million in November 2025 to approximately $38 million this April.
This recent drop in demand is significant because ETFs had been a major factor supporting Solana’s price throughout 2025. Consistent purchases from institutions had previously helped to soak up available SOL and fueled price increases during market recoveries.
Recently, a decrease in investments indicates that institutions might be growing more hesitant as the overall feeling towards cryptocurrencies becomes more negative.
I’ve been watching the Solana market closely, and it seems like traders are getting a bit cautious. I’m seeing a drop in open interest for Solana futures – it’s gone from around $6.77 billion to almost $5.45 billion recently. To me, that suggests people are actually *reducing* their risky bets instead of doubling down and preparing for another price surge. It’s a sign of hesitation, and I’m taking note.
When open interest decreases as the market goes down, it usually means investors are becoming more cautious and pulling back, leading to less buying and overall confidence.
Currently, there are slightly more traders betting that prices will fall than those predicting they will rise, as shown by a key ratio dropping to 0.97. This ratio typically falls below 1.0 when traders anticipate prices will continue to decrease.
The recent decline in how traders are using Solana-based derivatives is a significant shift. Earlier in the year, they consistently bet on SOL’s price increasing, even when the overall market was unstable.
Honestly, one thing that’s been bringing the market down a bit is that the hype around meme coins on Solana seems to be dying down. It was a big driver of activity for a while, and now that’s slowing, it’s affecting overall confidence.
Solana’s rapid price increase in late 2024 and early 2025 was largely due to a surge in trading of meme coins. This activity significantly boosted the number of transactions on the blockchain, usage of decentralized exchanges, and the number of users actively using the network.
But that popular idea has become less common in recent months, as traders have shifted their focus to different areas and become less willing to take risks.
There’s been a decrease in new, popular meme coins gaining attention from individual investors, which has led to less activity on the network. This makes it difficult for those hoping for the price to quickly rise back to the $100 mark.
Despite recent challenges, Solana’s underlying technology and overall ecosystem are still quite solid when compared to other similar blockchain networks.
The blockchain is still handling more than 100 million transactions each day, and a large amount of stablecoins are being used for settlements. Experts believe that if the overall economic situation gets better, increased long-term interest from institutions could help to steady prices.
Currently, traders seem much more concerned about potential short-term price drops than about the company’s long-term growth prospects.
Can Solana avoid a deeper breakdown below $80?
For bulls, the most important level now appears to be the $80–$82 support zone.
This area has consistently served as strong support during Solana’s recent price stabilization, and it corresponds with the bottom edge of the current downward-trending pattern.
If the price falls below that current support level, it could lead to a significant drop, potentially reaching $78 and even $70.
This bearish flag pattern suggests Solana’s price could fall by approximately the same amount it previously dropped before stabilizing. If this pattern holds true, Solana could see a considerable price decrease in the coming weeks or months.
At the same time, broader crypto market conditions remain fragile.
Bitcoin is having trouble staying above important price points. This is happening as rising interest rates and general economic worries are causing investors to sell off risky investments. Other cryptocurrencies, like Solana, tend to fall even more sharply during these times because they are more sensitive to market changes.
Even if the current downward trend seems likely, Solana could still prove it wrong by rising back above $98.
If the price consistently rises above this point, it could encourage traders who bet against it to buy back in, potentially driving the price up toward the $110–$120 range. This would likely need to be supported by more money flowing into Solana-based ETFs, a more positive outlook on financial instruments related to Solana, and increased interest from speculative investors within the Solana network.
As a crypto investor, I’m seeing some concerning signals for Solana (SOL) right now. The technical charts aren’t looking great, fewer people seem to be actively trading it, and most traders are leaning towards a negative outlook. All of this suggests SOL could fall further, and it’s really trying to hold onto a key support level that’s been important all year. I’m watching closely, as a break below that level could mean more losses are coming.
Read More
- APT PREDICTION. APT cryptocurrency
- BNB PREDICTION. BNB cryptocurrency
- WLFI PREDICTION. WLFI cryptocurrency
- ICP PREDICTION. ICP cryptocurrency
- DASH PREDICTION. DASH cryptocurrency
- EUR INR PREDICTION
- Nvidia Stock Price: Bull Flag Pattern Signals May 2026 Rally?
- HYPE PREDICTION. HYPE cryptocurrency
- SOL PREDICTION. SOL cryptocurrency
- USD JPY PREDICTION
2026-05-19 20:57