In the vast and often bewildering world of digital currencies, the TRUMP coin has been quietly and consistently performing a dance of its own. At $8.79, the coin has gracefully ascended by 1.2% over the past 24 hours, while still retaining a respectable 4.24% gain over the week. With a market capitalization of $1.75 billion and a daily trading volume that has soared to $355 million, the token has once again captured the attention of the financial world.
A complex interplay of technical signals and external narratives, such as the whispers of ETF speculation and the ever-present hum of political discourse, is shaping the coin’s near-term destiny. Let us delve into the current market landscape and what it might portend for traders in the days to come.
Why is TRUMP Price Rising?
Two significant forces are propelling the recent ascent of TRUMP’s value. Firstly, the rumor mill has been abuzz with talk of Canary Capital’s TRUMP ETF filing, which has rekindled a spark of hope among investors. The prospect of an ETF linked to this token promises to bring it into the limelight of mainstream investment, thereby intensifying the buying frenzy.
Secondly, one cannot overlook the power of the political narrative. Social media platforms have been flooded with discussions and commemorations of key dates and events, drawing a new wave of attention to the TRUMP coin. 📢👨👩👧👦
TRUMP Price Analysis
From a technical perspective, the price action of TRUMP is a fascinating spectacle of a battle between bulls and bears. Currently, the token stands above its 7-day Simple Moving Average (SMA) of $8.46, a sign of short-term strength. However, it lingers below the 30-day SMA of $8.69, suggesting that the broader trend is yet to fully embrace a bullish stance.
The technical indicators tell a story of their own. The Relative Strength Index (RSI14) hovers at 50.51, indicating a neutral sentiment. On the other hand, the Moving Average Convergence Divergence (MACD) histogram rests slightly in positive territory at +0.055, hinting at a short-term bullish divergence that could pave the way for further gains.
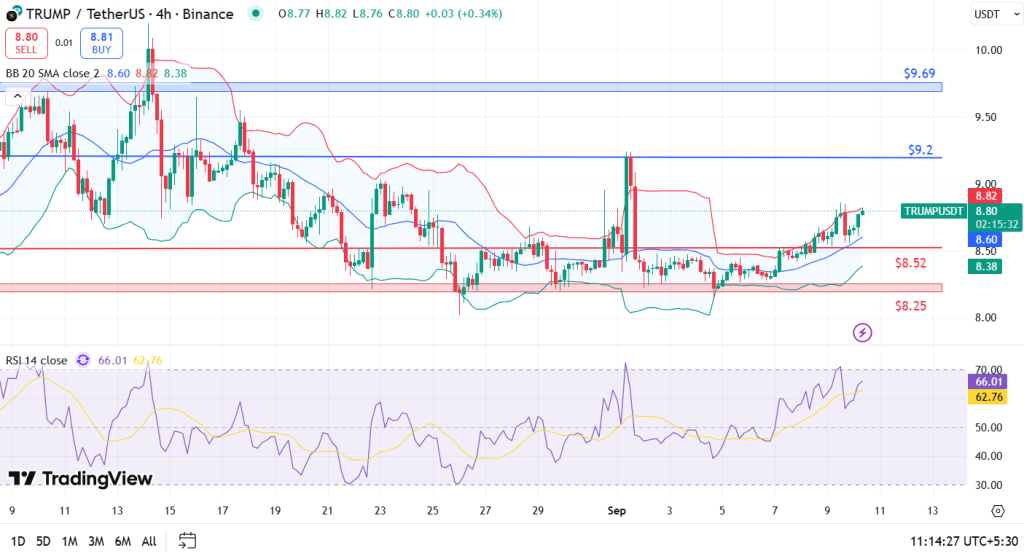
On the chart, traders are closely watching key Fibonacci levels. The immediate resistance for TRUMP is set at $9.20, a level that has historically acted as a formidable barrier. Should the price breach this level, the 23.6% Fibonacci retracement at $9.69 becomes the next critical hurdle. A successful breakout here could propel TRUMP toward the $10.19 mark, a milestone that would solidify a robust bullish trend.
However, support levels are equally vital. Should the coin fail to maintain its upward trajectory, the first line of defense lies at $8.52, near the 78.6% retracement. A more pronounced correction could see TRUMP retreat to $8.25, where a rare double bottom pattern may offer a lifeline to bulls should the selling pressure intensify.
FAQs
What is the immediate price target for TRUMP?
The next major resistance is at $9.69. A breakthrough above this level could see TRUMP aiming for $10.19.
What happens if TRUMP fails to hold support?
If support at $8.52 is breached, the price may fall to $8.25, a zone where a double bottom pattern could provide a potential rebound.
Why is Donald Trump coin price going up now?
The rise is fueled by ETF speculation and the politically charged atmosphere on social media, driving both sentiment and demand.
Read More
- Brent Oil Forecast
- Silver Rate Forecast
- Gold Rate Forecast
- TRX PREDICTION. TRX cryptocurrency
- EUR AUD PREDICTION
- BlackRock’s ETHB ETF: Staking Your Way to Wealth (or Figment’s Paycheck)
- It’s Official: UK Grants Bitcoin And Crypto Full Legal Asset Status
- Oh, the Folly! Strategy’s Bitcoin Splurge: $1.57 Billion on Digital Dreams!
- How Stablecoins Turn Crypto Chaos Into Everyday Wallet Power: A Dostoevskyan Reflection
- NFTs: The Great Digital Exodus Begins 🚀💰
2025-09-10 09:24