Well, well, well. Looks like Uniswap has decided to wake up from its nap and stretch its legs. 🦸♂️ After what felt like an eternity of sideways snoozing, the asset has finally broken out of its consolidation zone, and now everyone’s acting like it’s the second coming of Bitcoin. 🤑 But hold your horses, folks—let’s not crown it just yet.
Trading volumes are doing their thing, moving averages are moving (shocker!), and momentum indicators are being watched more closely than a reality TV star’s Instagram. 📈 At the moment, the MACD signal is weaker than a decaf latte, and UNI is hovering around $10.13, looking about as decisive as a toddler in a candy store. 🍭
Trendline Breakout: The Crypto World’s Version of a Plot Twist 📉➡️📈
The daily chart, courtesy of the ever-insightful Crypto Hashmi, shows a breakout from a multi-month descending trendline. 🎉 This is apparently a big deal, like discovering your socks match after weeks of chaos. It suggests the end of a prolonged downtrend, marked by a close above $9.50—a number that’s now being treated like the golden ticket from Willy Wonka’s factory. 🏅
UNI is now trading above the 20-day and 50-day EMAs, which have conveniently flipped to support zones. The breakout came with increased volume, proving that real humans—not just bots—are actually interested. 🤖✋
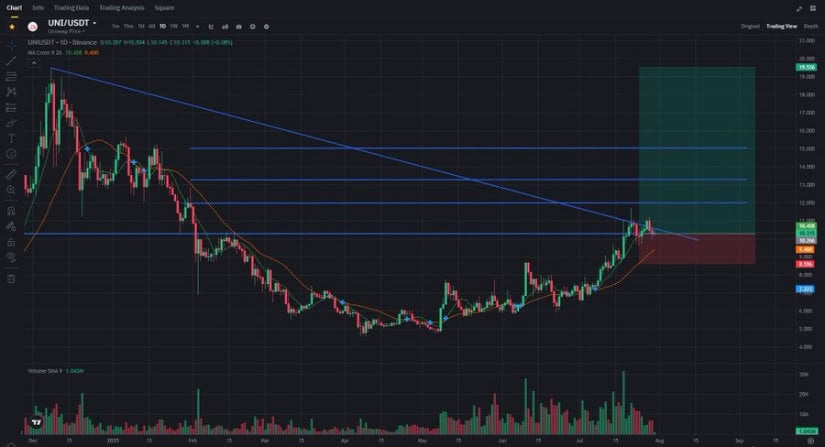
Hashmi’s chart points to potential upside targets at $11, $13, and $14, which are basically the crypto equivalent of “maybe, possibly, if the stars align.” 🌟 The risk-to-reward ratio looks decent, assuming you’re the type who enjoys placing bets on a coin flip. 🎲
This setup might lure in more technical traders, but let’s not forget the $10.50–$11.00 range, which is acting like the bouncer at an exclusive club. 💃 Only a strong close above it will get you past the velvet rope.
24-Hour Chart: More Drama Than a Soap Opera 🧼
Between July 30 and 31, UNI decided to live its best life, experiencing intraday volatility that would make a soap opera writer blush. 🧼 The price started near $10.30, took a nosedive below $9.90 (thanks, sellers!), and then rebounded like a trampoline. But it couldn’t quite reach its previous highs, forming a lower high around $10.20. Talk about commitment issues. 💔
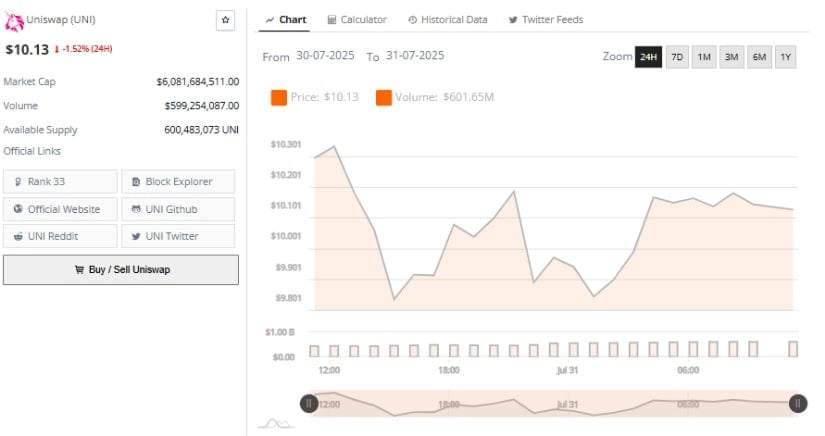
Volume clocked in at $601.65 million, steady as a rock. 🪨 But despite all the trading, the price barely budged, suggesting we’re in a distribution phase. Traders are either cashing in their chips or waiting for the next big move. If UNI holds above $9.90, it might build a base for further gains. But if it dips below, we could see a retest of $9.50 or $9.20. 🕳️
MACD and RSI: The Party Poopers of the Crypto World 🎉✋
Technical momentum indicators are starting to look like they’ve had one too many. 🍸 The MACD line is below the signal line, and the histogram is negative—basically, it’s the crypto version of a hangover. 🤢 This often signals a consolidation or pullback, especially after a rally that felt like a sugar rush. Traders are watching this like hawks, waiting for confirmation before making their next move. 🦅
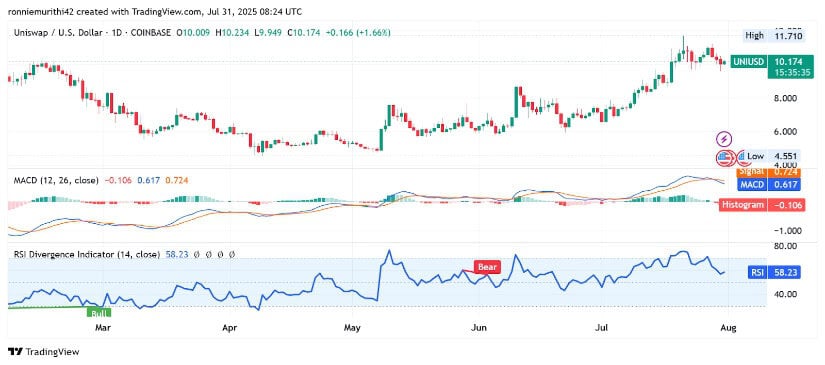
The RSI is at 57.78, above 50 but trending downward faster than a forgotten New Year’s resolution. 📉 If it dips below 50, it might signal further retracement. To keep the bullish dream alive, UNI needs to hold RSI above 50 and price support around $10.00. A breakout above $11.71 could set the stage for a rally toward $19—or so the analysts say. 🌙
So, is Uniswap headed to the moon, or is this just another crypto rollercoaster? 🎢 Only time will tell. In the meantime, grab your popcorn and enjoy the show. 🍿
Read More
- Gold Rate Forecast
- Brent Oil Forecast
- USD PLN PREDICTION
- Bitcoin: Is the Bubble Finally…Deflating? 📉
- Stablecoin Saga: Korea’s Rules Delayed 😮
- Ah! La Monnaie Digitale Tremble devant les Guerres et Trump!
- Solana’s Plunge: A Tale of Memecoins, Rewards, and Falling Revenues 🚀💸
- Silver Rate Forecast
- GBP USD PREDICTION
- USD VND PREDICTION
2025-07-31 22:02