The price of BNB is currently stabilizing in a pattern that suggests it could soon fall. It’s being held up around $600, but is facing increasing selling pressure, making a price drop likely.
Summary
- BNB price trades near $616, compressing within a descending triangle with key support at $600 and resistance around $625–$630.
- Price remains below major moving averages, with bearish MACD divergence and weakening momentum signaling downside risk toward $579–$580.
- Broader market pressure persists, with Fear & Greed Index in fear territory and Bitcoin’s $70K–$72K support seen as critical for BNB’s direction.
On May 1st, BNB was trading at approximately $616, according to crypto.news data. This represents a slight decrease of about 1% over the last 24 hours. Throughout the past week, the price has fluctuated mainly between $600 and $635, suggesting a tightening trading range and a potential breakout point.
The asset’s price is still well below its peak for the year, currently more than 30% down from levels above $900. Trading activity has slowed, and the price hasn’t shown strong movement in either direction. When the price stays within a narrow range near a key support level, and volatility decreases, it often suggests a significant price change is coming.
The price of BNB could still fall further, as overall market conditions continue to put pressure on risky investments like it.
The Crypto Fear & Greed Index is still quite low at 26, suggesting investors are currently cautious and avoiding big risks. Traders aren’t rushing to buy when prices drop, likely because of the ongoing economic uncertainty.
BNB’s price tends to move with Bitcoin. Experts are cautioning that if Bitcoin falls below the $73,000–$74,000 level, it could start a larger price drop across the crypto market, potentially causing the value of altcoins like BNB to decrease.
Overall market uncertainty is increasing due to the economic environment. Worries that the Federal Reserve will keep interest rates high are making it harder to invest in riskier assets. Important upcoming economic reports, like the jobs report on May 8th and inflation data on May 12th, could cause significant price fluctuations.
BNB price analysis
Looking at the daily price chart, BNB is currently forming a descending triangle pattern, which often signals a potential price drop. It’s bouncing off support around $580, but struggling to break past a downward trendline that’s been in place since February.
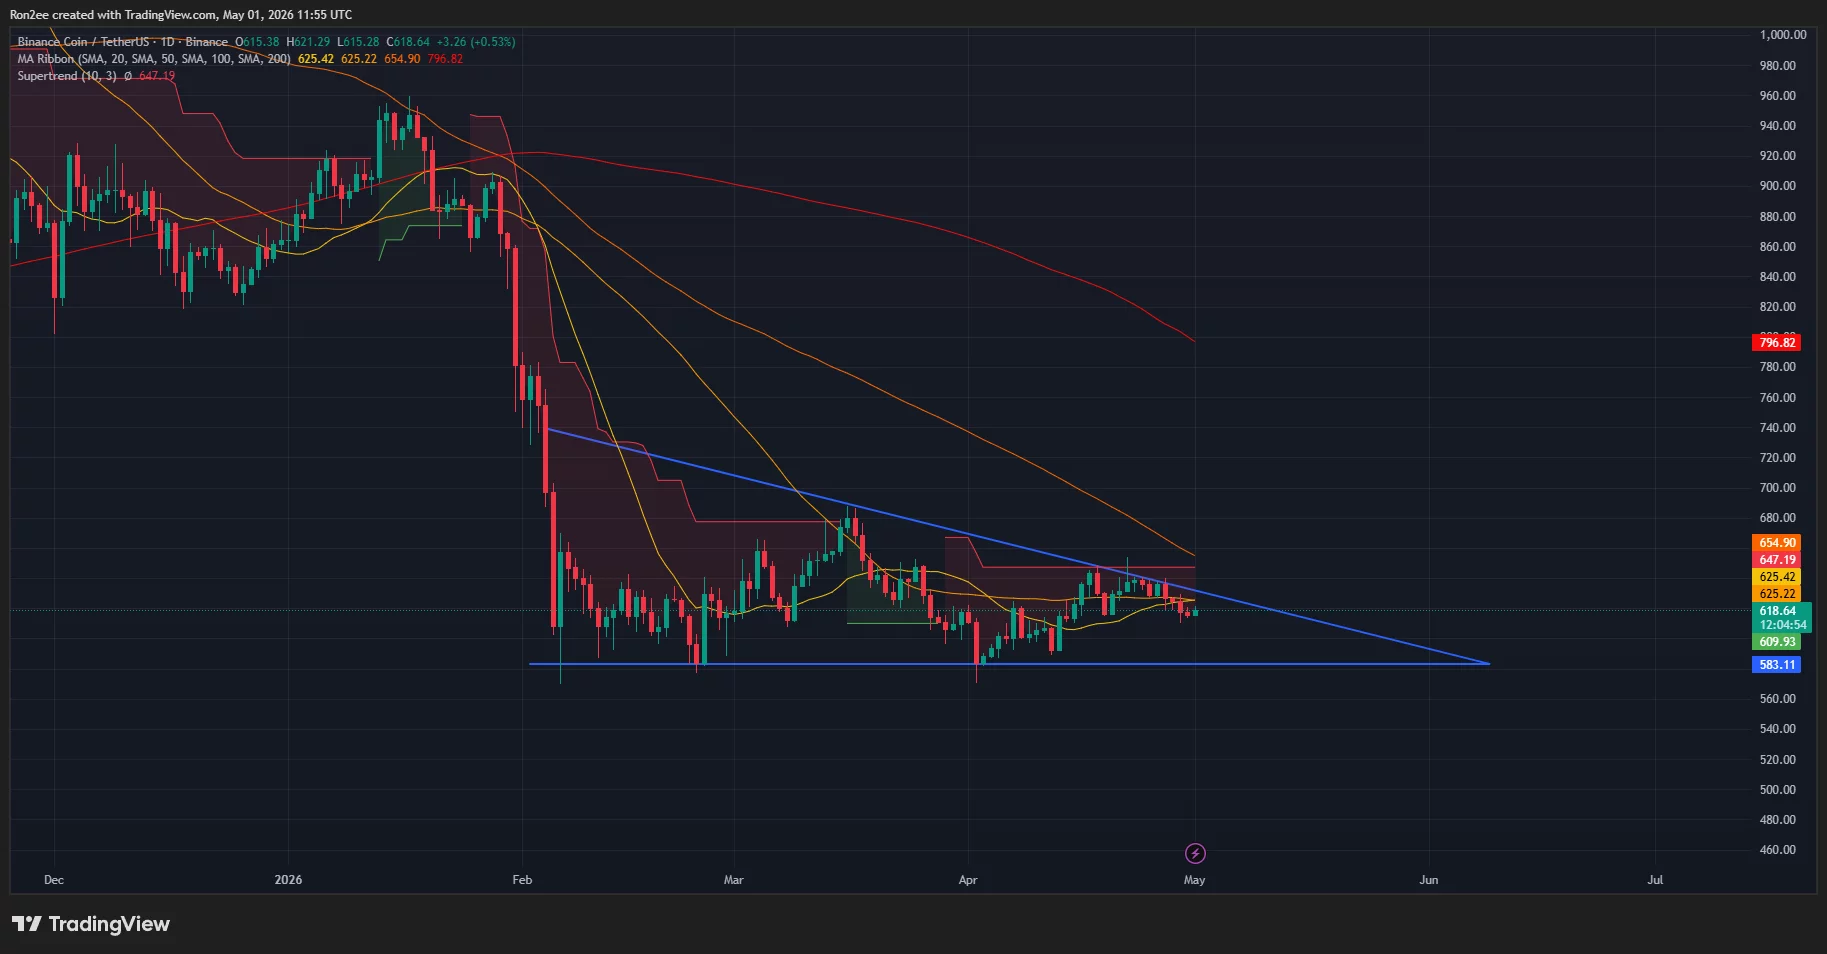
Price testing around $600 to $610 shows buyers are still trying to hold that level, but each time the price rises from there, it’s happening with less strength, suggesting interest is decreasing.
Technical indicators suggest BNB is trending downwards. Currently, its price is below the 50-day moving average at around $625, which now acts as a ceiling. The longer-term moving averages at $654 and $796 confirm this ongoing downward trend.
The MACD indicator is showing a bearish divergence on the daily chart, which means the recent upward price movement is losing steam, even though the price has tried to hold steady.
If the price falls cleanly below $600, it would confirm a downward trend and likely lead to a further drop, potentially reaching the next support level around $580.
However, if the price rises strongly above the downward trendline and retakes the $625–$630 range, it would suggest our current expectations are incorrect and buyers might regain control. While possible, this seems less likely in the near future based on current indicators.
Read More
- Silver Rate Forecast
- Gold Rate Forecast
- Brent Oil Forecast
- USD CNY PREDICTION
- DOGE PREDICTION. DOGE cryptocurrency
- GBP USD PREDICTION
- USD TRY PREDICTION
- Why Crypto Firms Still Can’t Break Up With Bitcoin 😂💸
- USD MYR PREDICTION
- XRP’s 2026 Bearish Betrayal: Wilde’s Witty Warning
2026-05-01 15:29