As of April 14, 2026, XRP is currently trading at $1.36. It’s been moving within a very narrow price range, which is unusual since it hit a high of $2.42 in January. While the overall market suggests prices may continue to fall, some technical indicators suggest a more complex short-term outlook.
Trading activity is slowing down, and large investors are currently less active than they’ve been in months. This suggests the market is preparing for a significant price change, and the eventual direction of that change will likely determine where XRP goes for the next several weeks.
XRP Daily Chart: Compression Below a High-Volume Wall
Looking at the daily chart, XRP hasn’t been able to break back above the $1.4244 price level, which is a key Fibonacci retracement. This level represents a potential resistance point, calculated using the price swing from a high of $2.42 in January to a low of $1.12 in February.
A strong resistance area (shown in yellow and blue) exists between $1.55 and $1.60. This aligns with a previous resistance level (red box) and represents the highest trading volume since the price dropped sharply in February. Until the price breaks above this level, any price increases could be temporary and misleading.
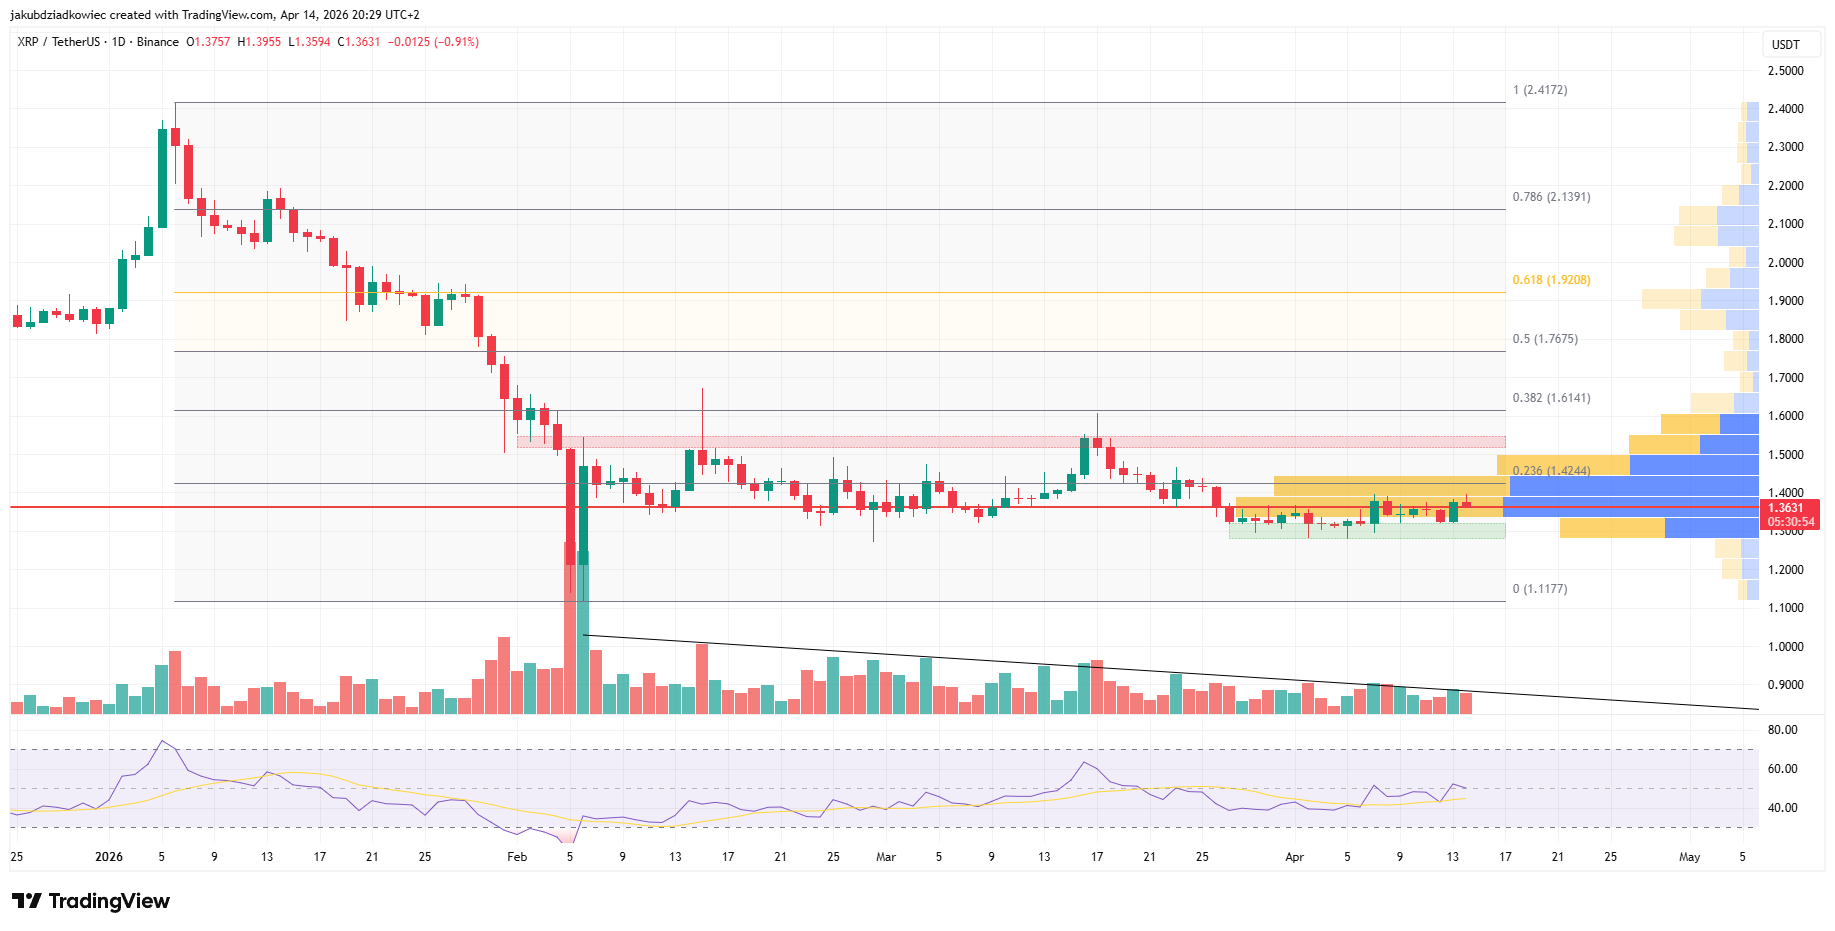
The Relative Strength Index (RSI) is currently between 40 and 45, which suggests continued downward price movement. Because it’s below 50, it indicates selling pressure is still present.
Trading volume has been consistently falling since February, as shown by the downward trend. This lack of interest at these price levels often signals that big price swings are likely to happen soon.
XRP 4H Chart: Channel Intact But Midline Rejected
In my analysis of XRP, I’ve observed that the price has been moving within a rising channel on the 4-hour chart since early April. This pattern indicates a potential short-term upward trend.
The price recently hit resistance around $1.36-$1.37, a key level to watch. For the price to continue going up, buyers need to push the price back above this level with strong trading activity.
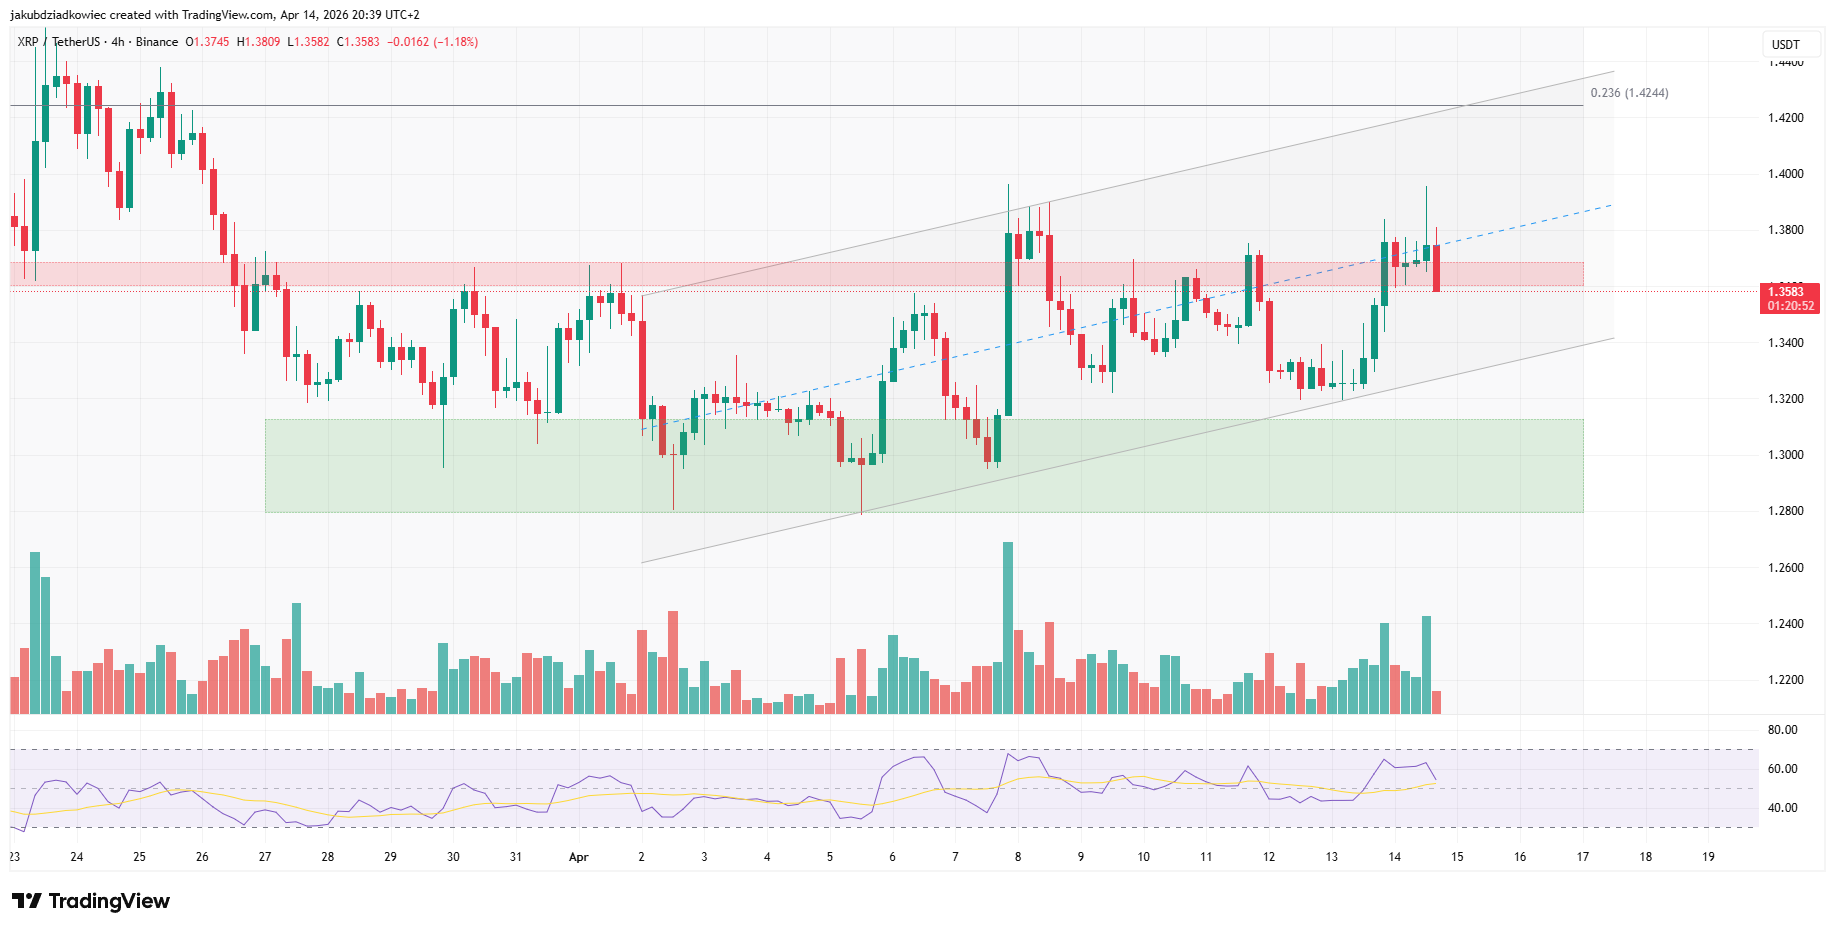
The 4H RSI sits at approximately 55, above neutral but declining — momentum is fading.
If the price stays above $1.36 and trading activity increases, it could lead to another attempt to reach the $1.42 to $1.44 range. This level also aligns with a key Fibonacci retracement level of 0.236.
If the price falls from here, it could drop further to test the support level between $1.28 and $1.30, which also lines up with a key trendline.
On-Chain: Whales Go Quiet — The Calm Before the Storm?
Looking at large XRP transactions (over $100,000) alongside its price movements reveals an interesting pattern. When XRP reached its highest price in early January, activity from these large holders (often called ‘whales’) was also at its peak. Now, looking back, this suggests they were selling off their holdings at that time.
The biggest jump in activity on the chart happened during the price drop to $1.12 on February 5th and 6th, suggesting that people were both rushing to sell out of fear and taking advantage of the low price to buy.
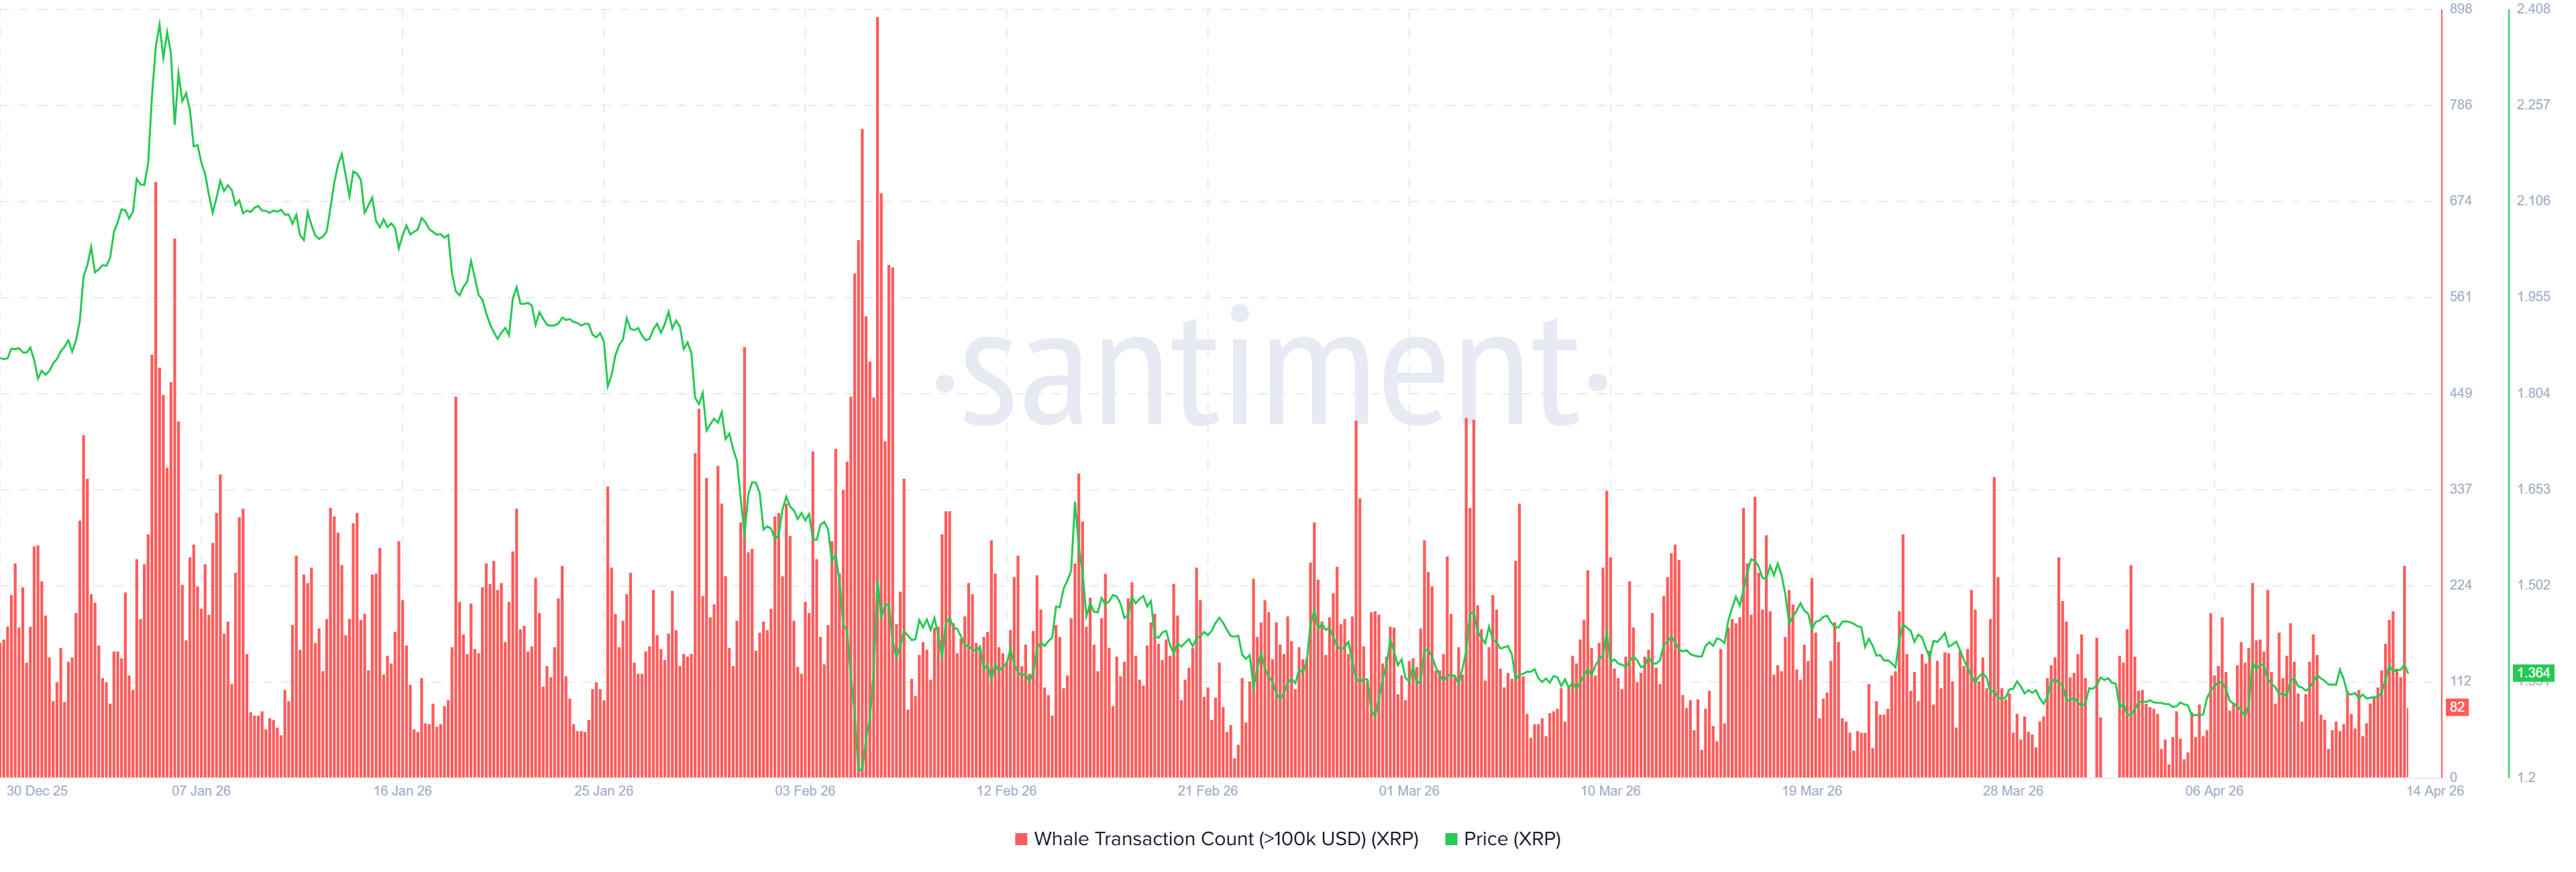
Since then, the number of large cryptocurrency transactions (made by ‘whales’) has decreased significantly, with April seeing some of the lowest activity levels since December.
The lack of activity on the blockchain, along with decreasing trading volume, indicates the market is likely preparing for a significant move – a period of consolidation before a breakout.
The key thing to watch is whether whales drive the price up or down – a move above $1.28 would confirm an upward trend, while a drop below it would signal a breakdown.
XRP Price Prediction: Two Scenarios
If the price closes above $1.37 on a 4-hour chart with increasing trading volume, it suggests a strong recovery and a successful return to the midline.
XRP is currently aiming for $1.42, a key level based on Fibonacci analysis. If it continues to rise, it could encounter strong resistance between $1.55 and $1.60. The most optimistic scenario predicts a price of $1.92, but this will only happen if XRP decisively breaks above $1.60 with significant trading volume.
Bullish invalidation sits at a daily close below $1.28.
If the price drops below $1.36 on the 4-hour chart, especially with decreasing trading volume, it would suggest a downward trend. This could quickly put support levels between $1.28 and $1.30 at risk.
If the price of XRP falls below $1.28, particularly with a sudden increase in large transactions, it would likely signal the end of the current upward trend and could lead to a drop back down to around $1.12.
Bearish invalidation sits at a confirmed daily close above $1.44.
Read More
- USD CNY PREDICTION
- USD THB PREDICTION
- Gold Rate Forecast
- Silver Rate Forecast
- USD KRW PREDICTION
- USD RUB PREDICTION
- GBP EUR PREDICTION
- USD BRL PREDICTION
- EUR USD PREDICTION
- USD HKD PREDICTION
2026-04-15 12:56