As an analyst, I’ve been watching XRP’s recent price movement, and it’s starting to affect how investors are behaving on major exchanges. I’m seeing a key change in the relationship between price and trading volume – specifically, the correlation between price action and cumulative volume delta is shifting. This change could be a significant indicator of where the market is headed, so I’m monitoring it closely.
A Notable Rise In XRP Price-CVD Correlation
I’ve been tracking XRP’s price, and although it dipped a bit yesterday along with the rest of the market, it’s still staying comfortably above $1.40. What’s really interesting is that I’m starting to see some changes in how traders are behaving, especially on Binance, which is where a lot of the trading activity happens.
Recently, CryptoQuant data analyst Arab Chain noticed a positive shift in the relationship between XRP’s price and its Cumulative Volume Delta (CVD) on the Binance exchange. This growing connection suggests that recent trading activity is becoming more confident, with buying and selling in the futures market increasingly reflecting actual price changes for the cryptocurrency.
As I’ve been tracking the market, I’ve noticed a strengthening connection between price movements and Cumulative Volume Delta (CVD) recently. Interestingly, this correlation appeared *before* the price began to fall again in the last few trading sessions. When this shift happened, XRP was trading around $1.44, and the overall buying and selling activity was still quite unpredictable.
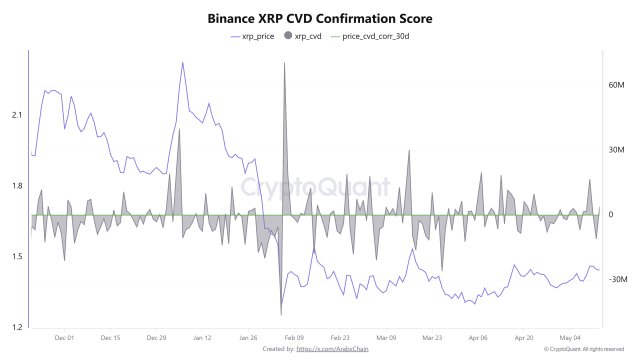
Looking at the chart over the past 30 days, a key indicator has risen to about 0.58. This shows a positive change in how price movements align with actual buying activity. This pattern usually means that price increases are supported by genuine purchases, not just speculative trading with limited available funds. It also suggests that traders are becoming more confident and that more money is flowing back into the market, even during a generally slow period.
The index initially rose but then began to fall as more XRP was sold than bought, with net outflows reaching approximately 10.9 million XRP. Interestingly, the price remained fairly steady above $1.44 during this shift. This difference between the falling buying pressure and stable price suggests a change in how money is flowing in the market – sellers are becoming more dominant even though the price hasn’t dropped much yet.
Investor Hesitation Or Liquidity Redistribution
Arab Chain pointed out that recent market activity suggests a pause or a shift in where money is flowing, which often happens after a period of strong growth. They noted that when price movements and on-chain transaction volume start to disconnect, it often signals a potential slowdown in price increases and could lead to more short-term price swings as selling pressure builds.
Despite a recent drop in Cumulative Volume Delta (CVD), XRP’s price hasn’t fallen much, which suggests continued demand is balancing out the selling. Traders are now closely monitoring the situation to see if the price will start to increase again.
Based on my observations, if current positive momentum continues, we could see prices keep rising. However, if we don’t see an improvement in market activity, I anticipate further price declines in the near future.

Read More
- XRP to the Moon? 🚀 AI Says $4.40, Analysts Scream $6! 🤑
- PENGU Price Soars 30% After SEC’s ETF Filing Acknowledgement: Is This the Next Big Thing? 🚀🐧
- Ripple Wades Through UK Regulators: The Promised Land or Just a Mirage? 🚀🔒
- Bitcoin vs. Ethereum: The Tale of Two Cryptocurrencies 🪙⚔️
- DASH PREDICTION. DASH cryptocurrency
- HYPE PREDICTION. HYPE cryptocurrency
- Ethereum’s Wild Ride: Bulls Stampede as Metrics Hit Record Highs 🚀🐂
- Shiba Inu Price Crash: The Saga You Won’t Believe
- Nvidia Stock Price: Bull Flag Pattern Signals May 2026 Rally?
- Bitcoin’s $106K Plunge: The Week’s Most Dramatic Fail 🤯💸
2026-05-15 04:57