So, Bitcoin’s clinging to $87,818 like it’s the last slice of pizza at a party. Market cap? $1.739 trillion. Volume? $72.66 billion. Impressive, right? Wrong. Underneath this circus of numbers, it’s a mess of trend exhaustion, technical resistance, and momentum that’s more indecisive than me at a buffet. 🥴
Bitcoin Chart Outlook (Or: How to Watch Paint Dry)
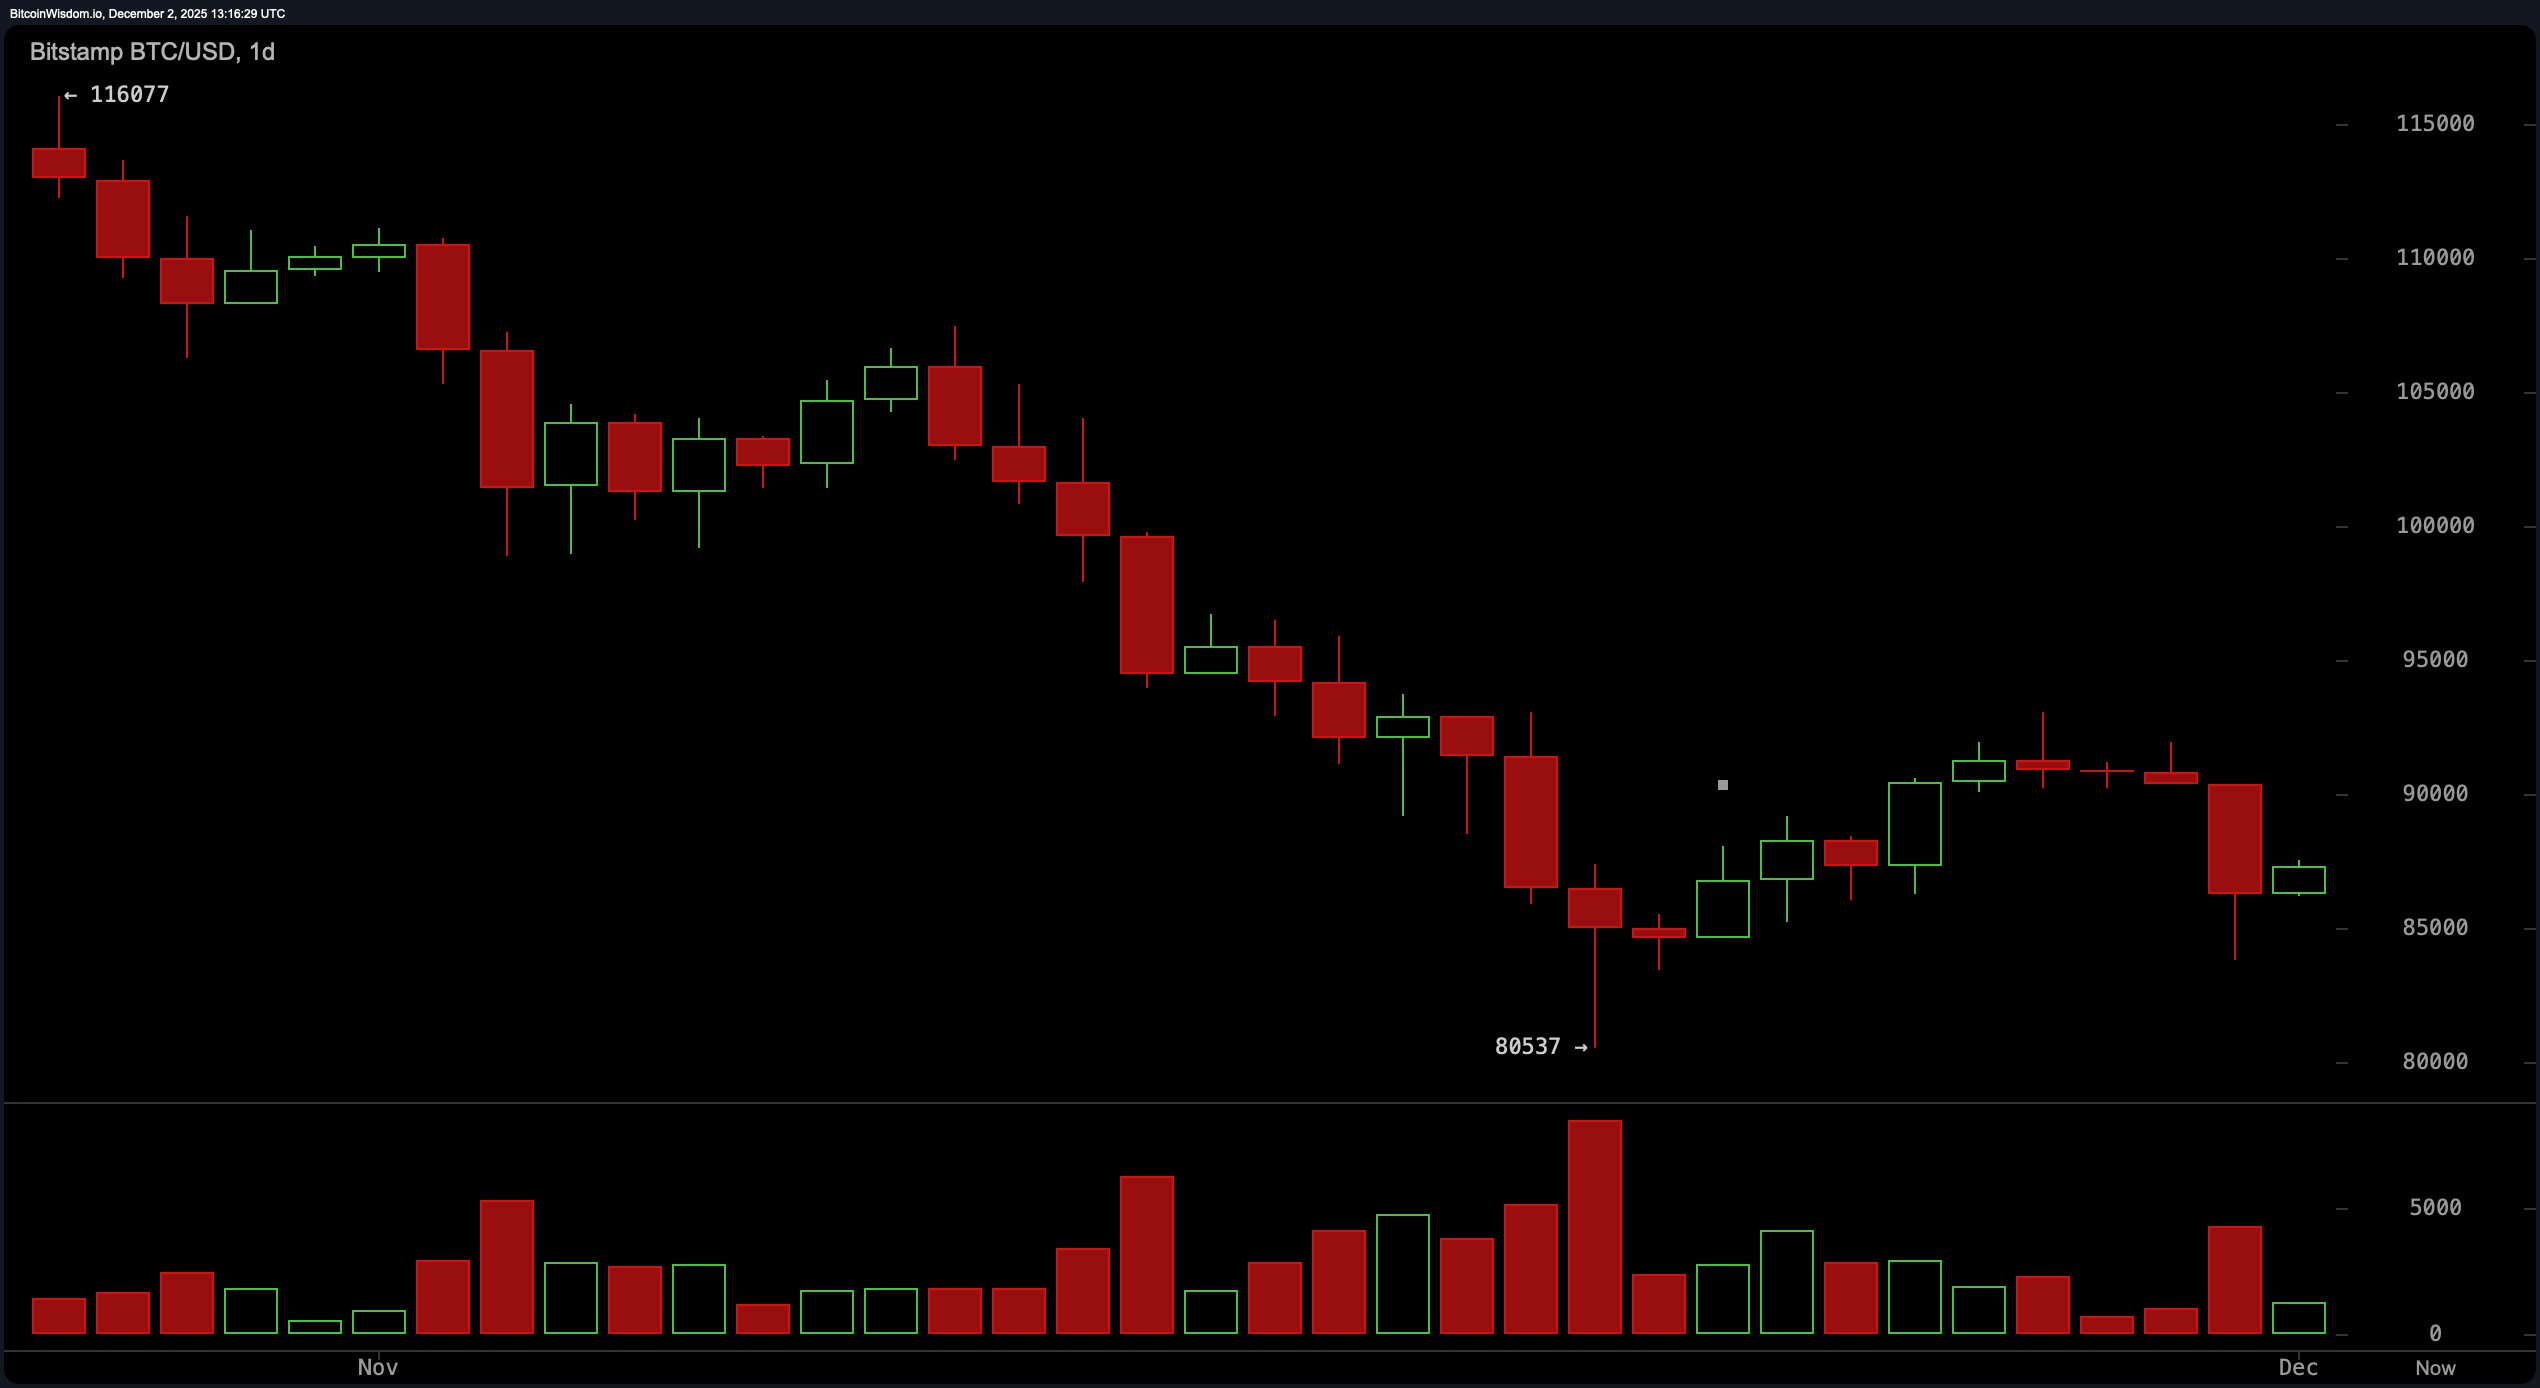
Daily chart? Bearish. Lower highs, lower lows-it’s like a sad country song. November’s price action? A red candle so big it screamed, “Sell! Sell! Sell!” near $91,000. Bounce from $80,537? Cute, but it fizzled out faster than my New Year’s resolutions. Volume’s up on the latest red candle, meaning sellers are having a party while buyers are stuck in traffic. 🚗💨
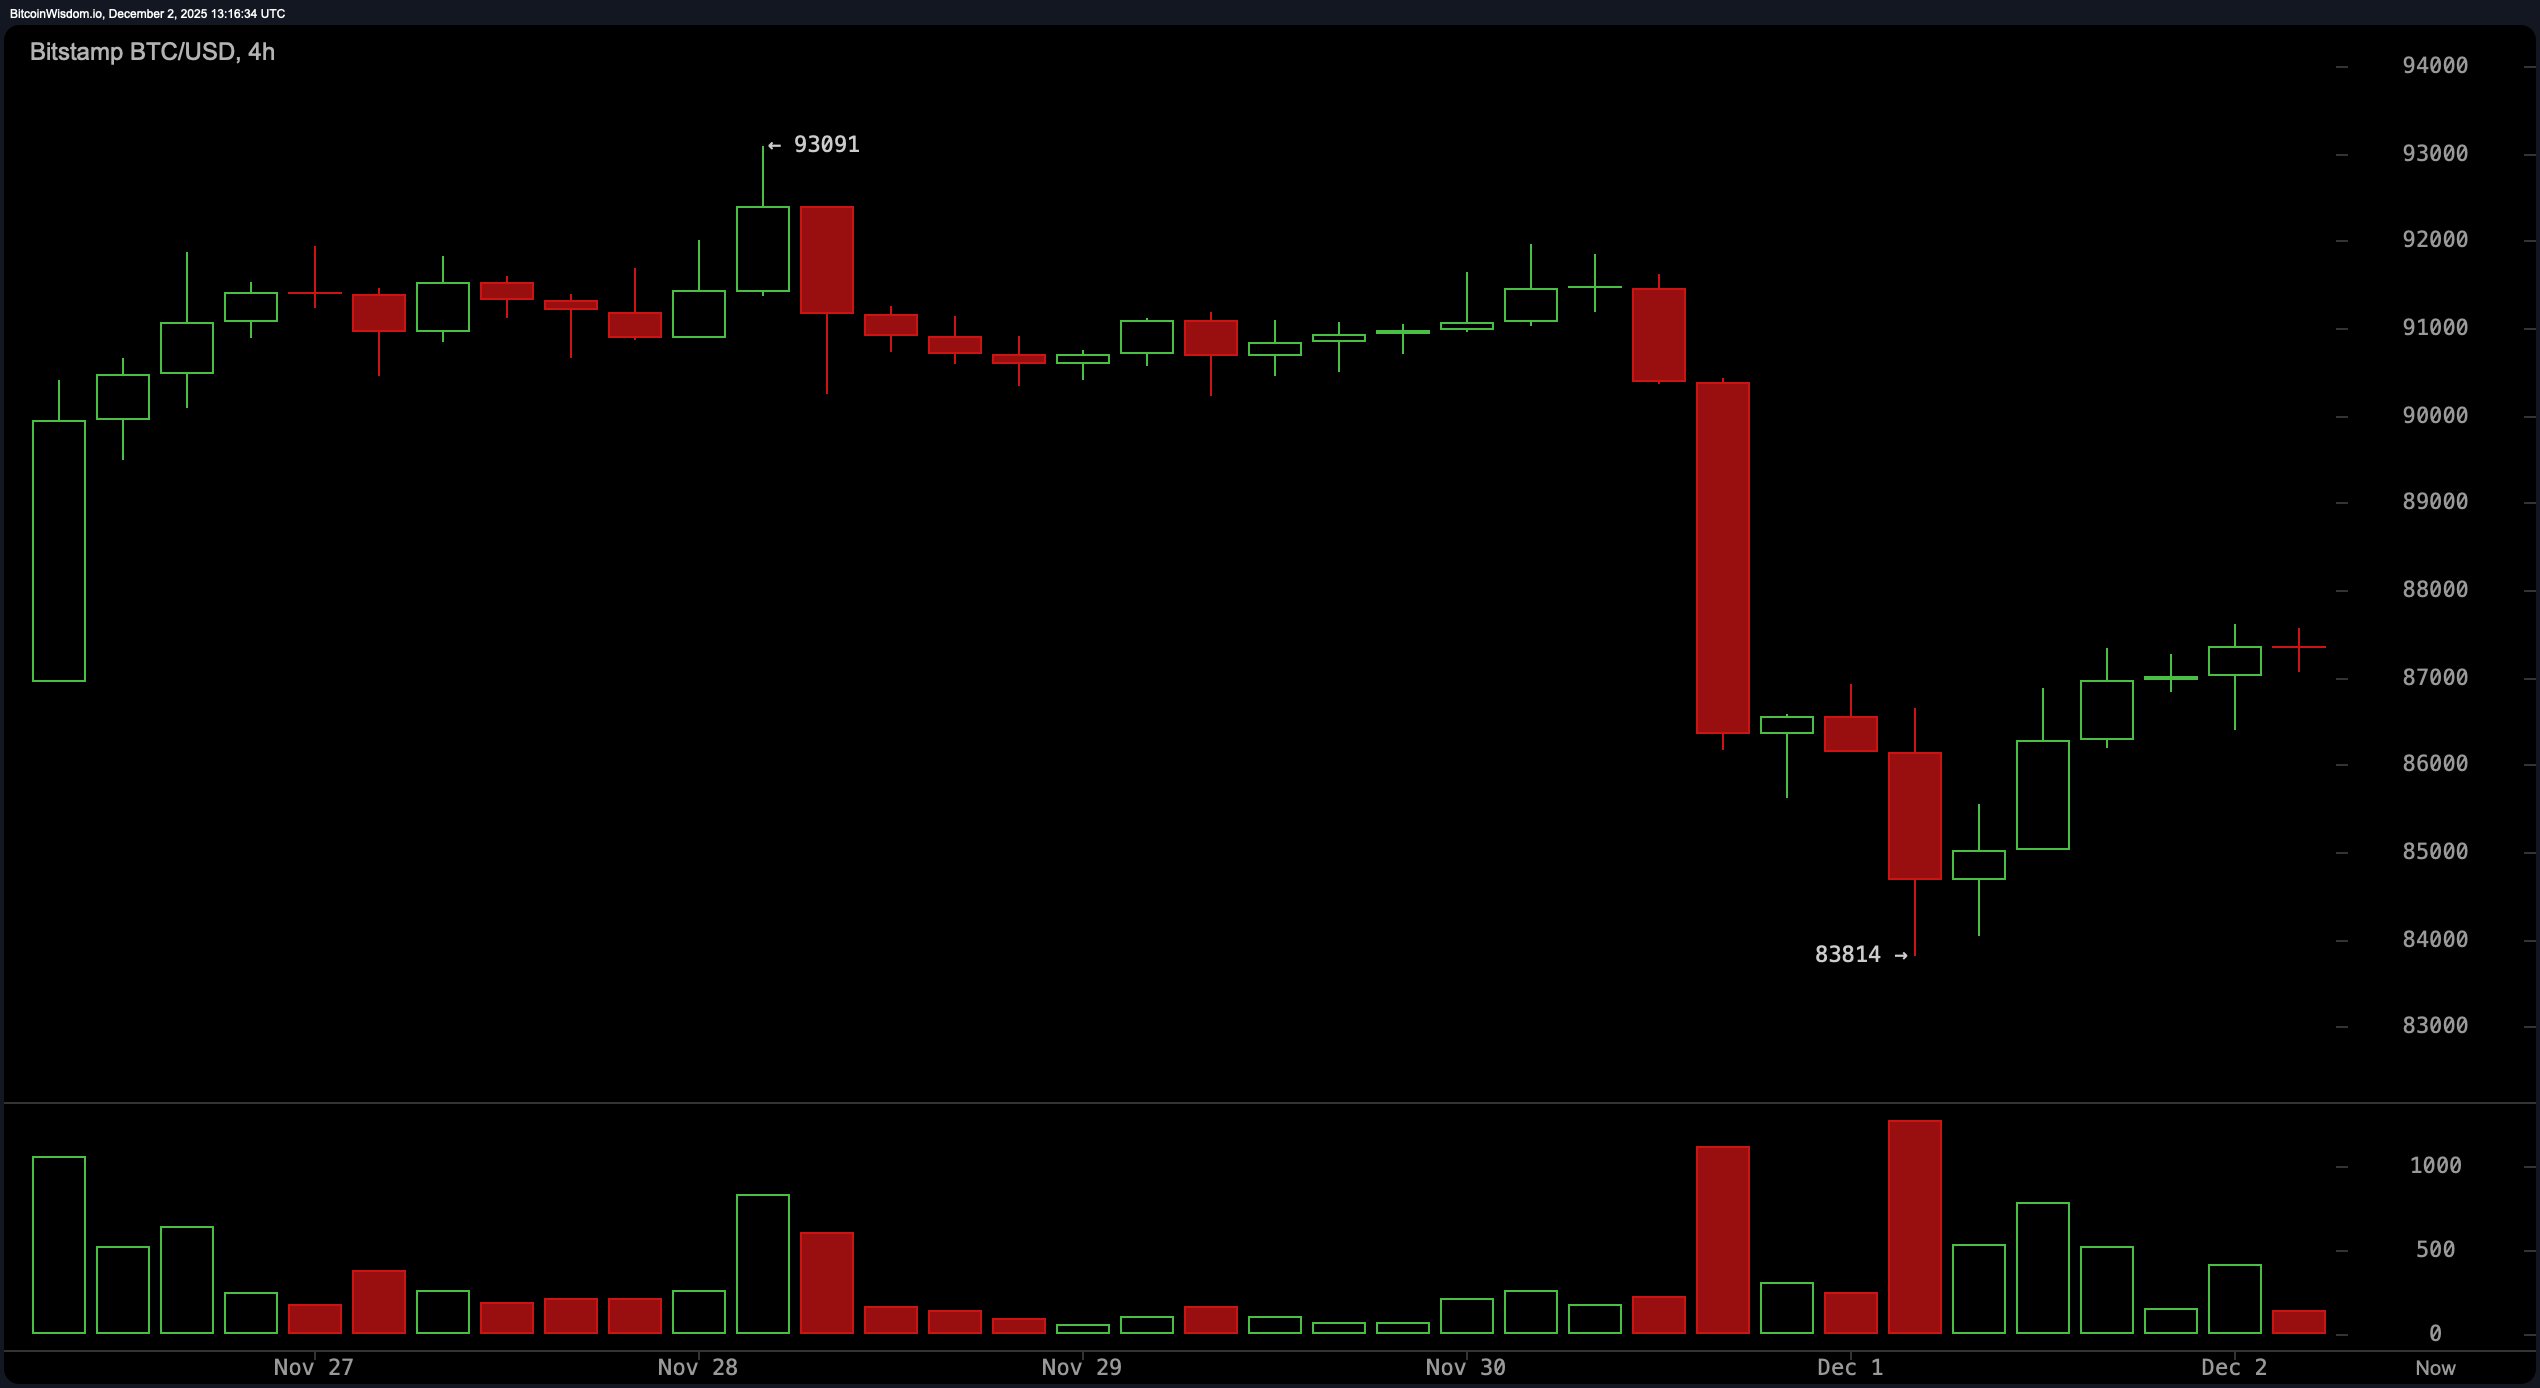
4-hour chart? Murky. Bitcoin rallied off $83,814 like it had somewhere to be, but hit a wall between $88,000 and $88,500. Momentum? Gone. Volume? Declining. Buyers? Probably napping. 😴 Unless it breaks $88,500 with some serious gusto, this is just a pit stop in Bearville.
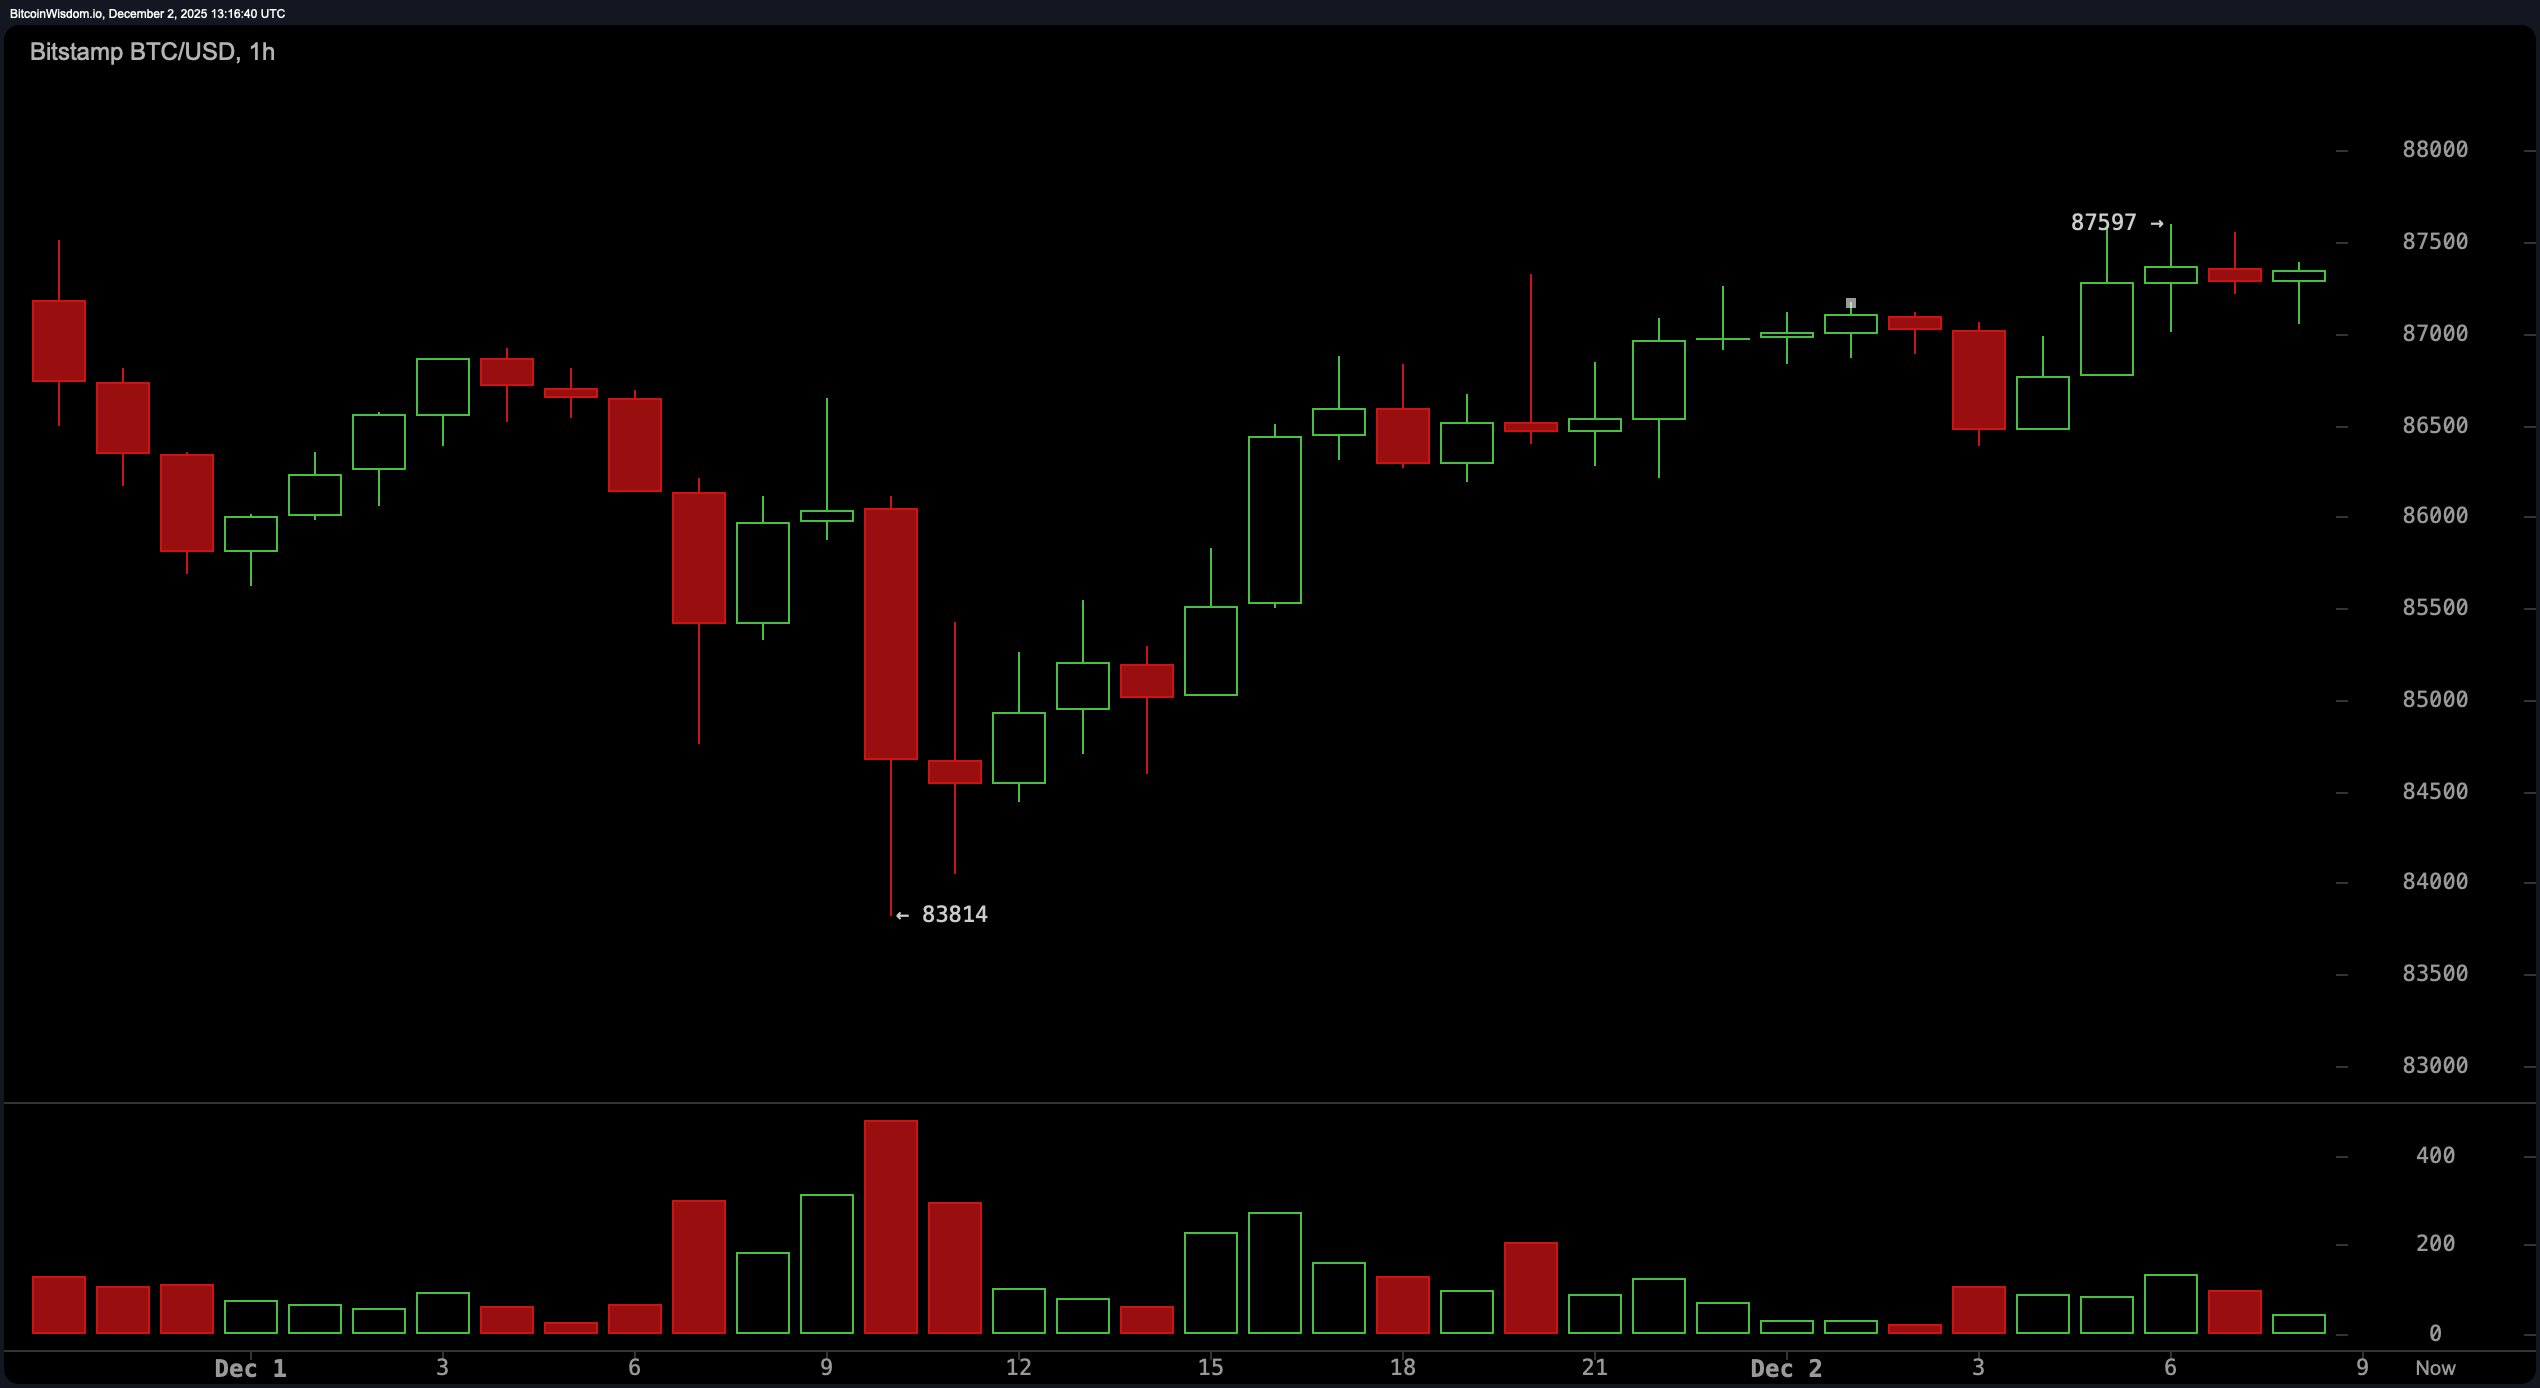
1-hour chart? A flicker of hope. Higher highs, higher lows-but it’s like a flickering candle in a hurricane. Poked at $87,600, got swatted back. If it dips below $86,000 on strong volume, it’s game over for this mini-rally. 🕯️💥
Oscillators? Shrugging like they just got asked a pop quiz question. RSI at 35, stochastic at 53, CCI at −71-basically, they’re as indecisive as me picking a Netflix show. ADX at 40 says the trend’s strong, but the awesome oscillator’s at −7,096, which is… not awesome. Momentum’s bullish at 2,481, but MACD’s at −3,772. Mixed signals? You bet. 🤷♂️
Moving averages? All pointing south. 10-, 20-, 30-, 50-, 100-, 200-period EMAs and SMAs are above the price, saying, “Not today, Bitcoin.” 200-period SMA’s at $109,562-good luck with that. Until Bitcoin breaks these, it’s just a rally looking for a reason to exist. And so far, it’s failing miserably. 😢
Bull Verdict: 🌈🦄
Glass-half-full crowd? The 1-hour chart’s your friend. Higher highs, higher lows, and a whisper of momentum. If volume shows up and $88,500 gets breached, maybe-just maybe-there’s a breakout. But don’t bet the farm. Or even the chicken coop.
Bear Verdict: 🐻🎉
Bears still rule. Downtrend’s the king, and every rally’s just a bear snack. Unless Bitcoin reclaims key levels with some serious conviction, this is just a slow march to nowhere. Or, you know, lower.
FAQ ❓ (Because You’re Probably Confused)
- Where’s Bitcoin going?
Down. Unless it’s not. Resistance at $88,500. - Key support?
$80,500. Bounced at $83,814. For now. - Recovery signs?
Mild bounce, weak momentum. Don’t hold your breath. - Technical levels to watch?
$88,500 resistance, $85,500-$86,000 support. Good luck.
Read More
- Brent Oil Forecast
- Silver Rate Forecast
- Gold Rate Forecast
- USD CNY PREDICTION
- Bitcoin at Halfway Through Halving: Gains Lag Behind Previous Cycles
- USD TRY PREDICTION
- DOGE PREDICTION. DOGE cryptocurrency
- Bitcoin’s $75K Drop: Trump vs. Iran Showdown
- CDC Boss Plays Keep-Away with COVID Vaccine Data – Scientists Cry Foul!
- USD CLP PREDICTION
2025-12-02 17:29