I once believed Bitcoin existed to prove I could own something more volatile than my temper. Today it looms at $87,867, the loudest reminder at the dinner table that I should probably diversify my regrets. Bitcoin still sits proudly atop a $1.75 trillion market cap, like a prize statue you only notice when the pedestal cracks. The 24-hour volume swells to $40.97 billion, while the intraday swing stays stubbornly narrow between $87,180 and $88,763. A tight price band with the drama of a soap opera-beneath the surface, the indicators are throwing sass and shade in equal measure.
Bitcoin Chart Outlook
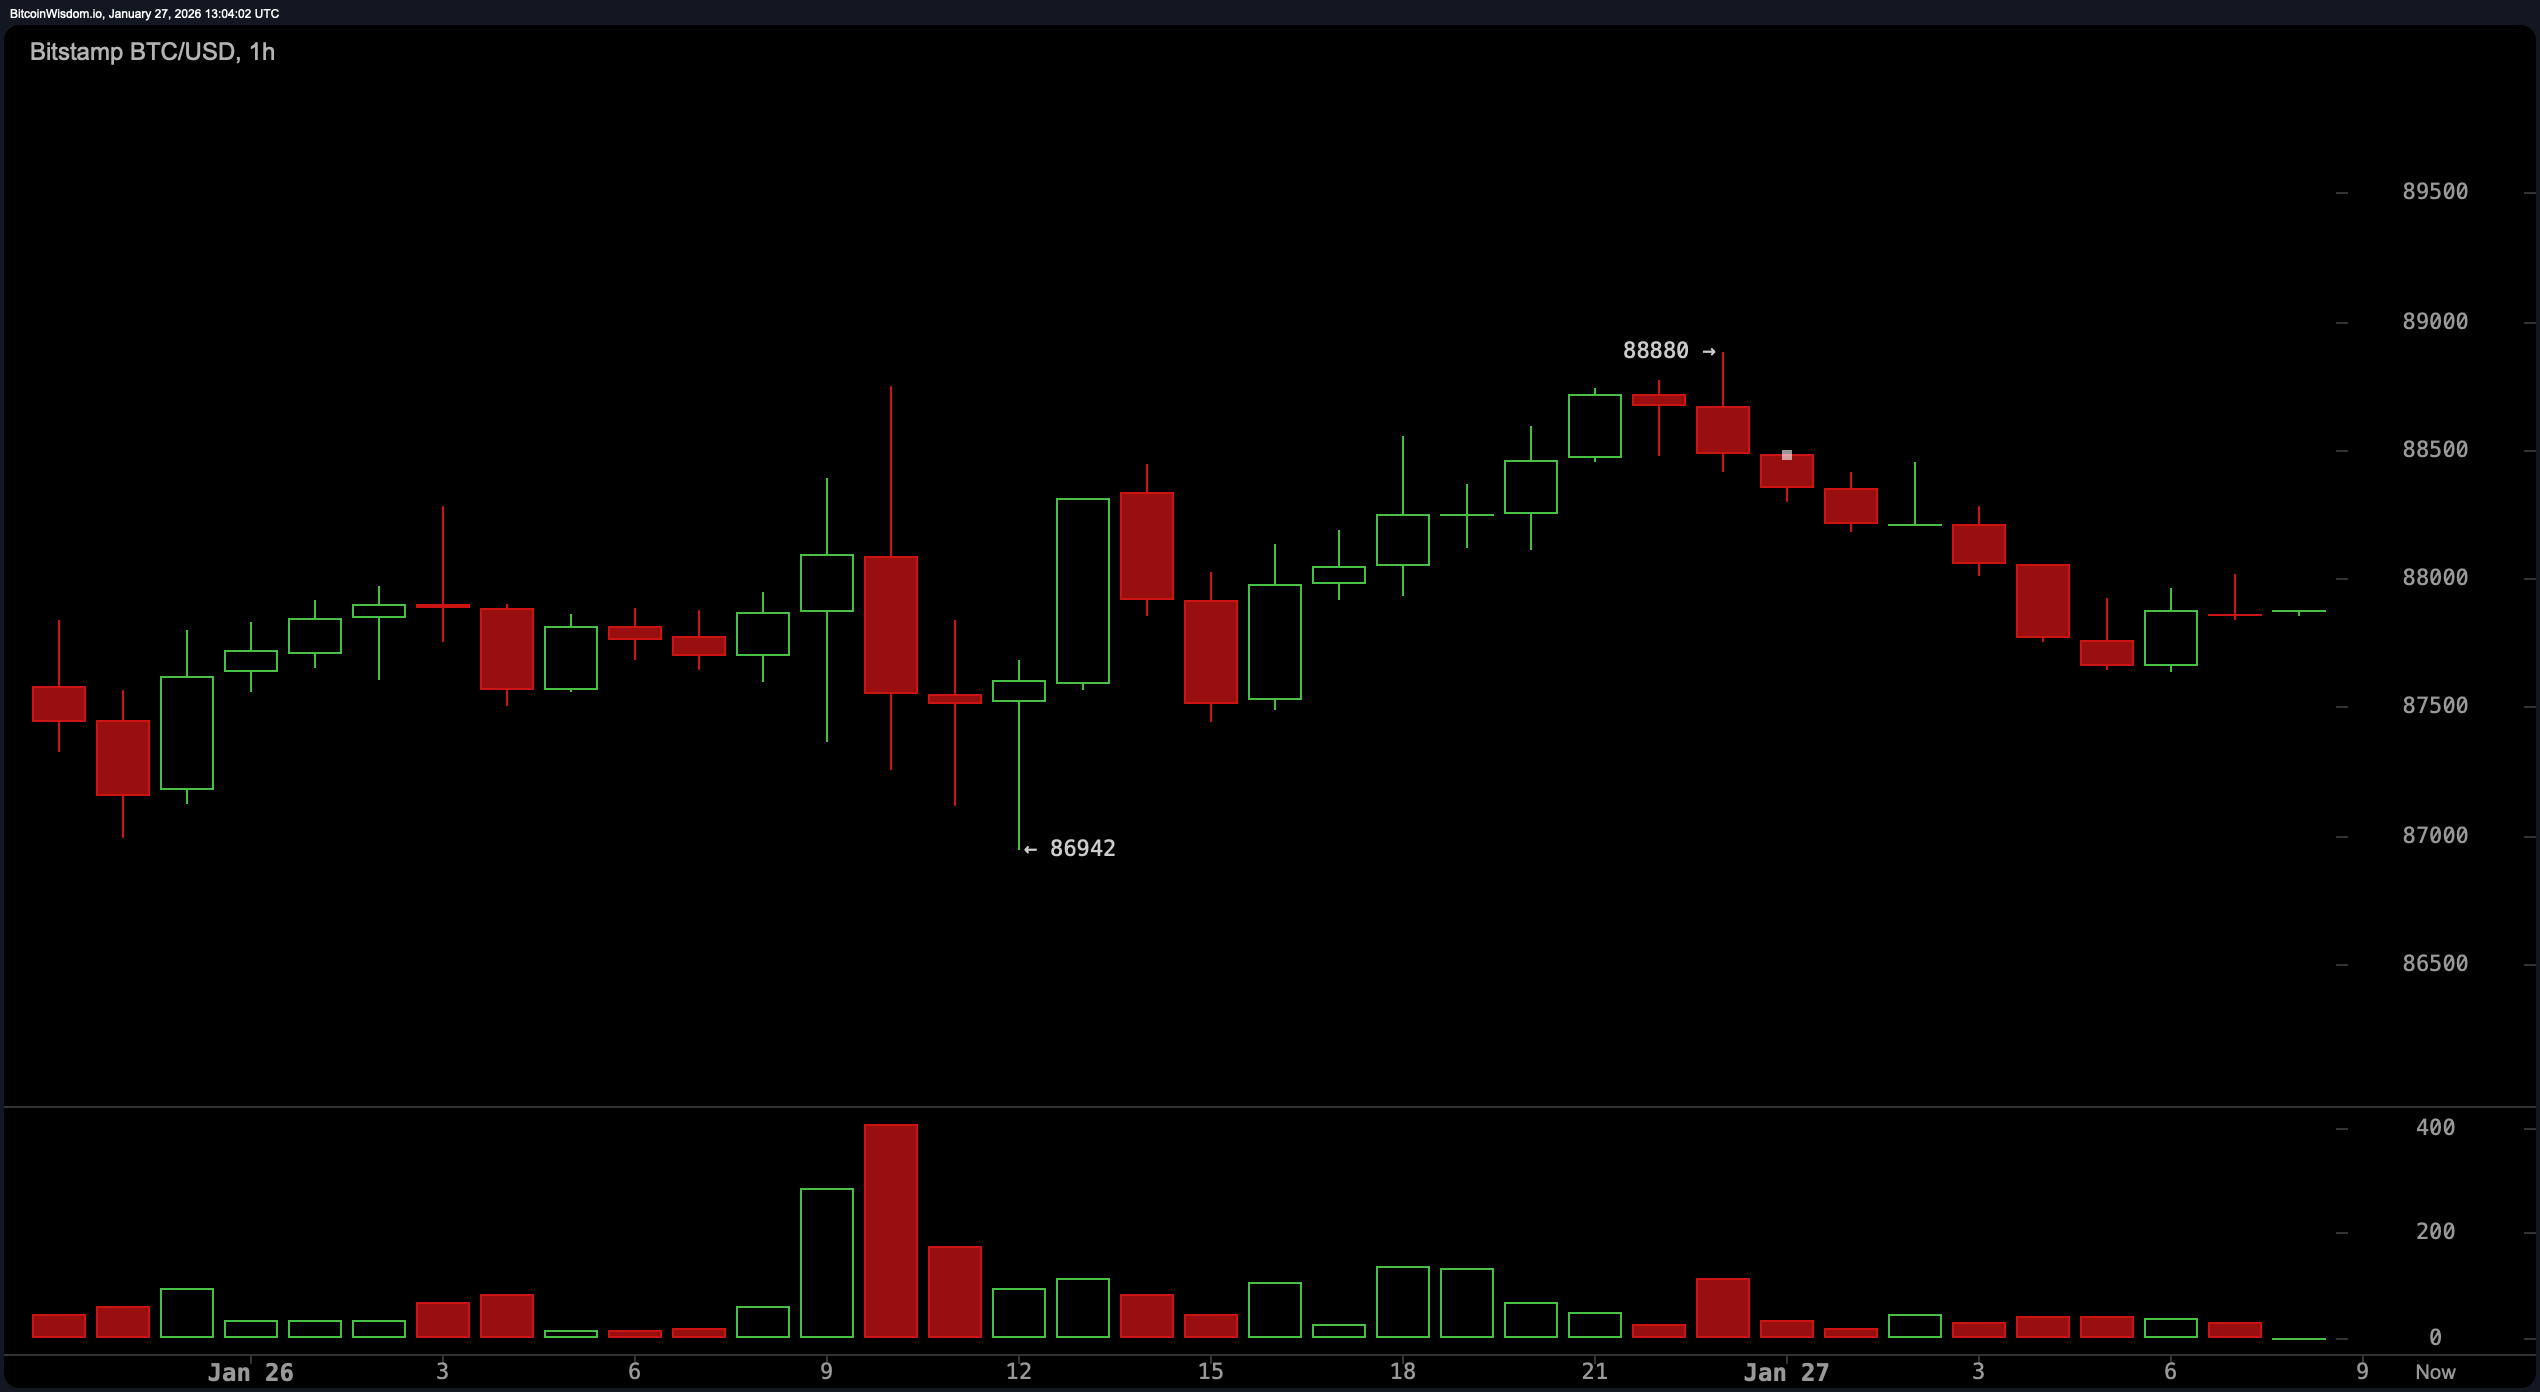
The hourly chart reads like someone who started a victory lap and forgot to finish the lap. A bounce from a local bottom at $86,942 to a high near $88,880 gave momentum a wink, but it’s since faded, leaving small-bodied candles and lower volume to signal indecision-like a crowd at a magician’s reveal, waiting for the rabbit that never appears.
The technical cliff notes? It’s a delicate waltz around $88,800. A bullish breakout above that level could flirt with $89,500, and maybe even wrestle with $91,000 if the cosmos grants a miracle. But a stumble below $87,800 threatens a retreat to the $86,000 neighborhood, with all the drama of a rerun. The micro-trend has slipped into a shallow downtrend, suggesting the enthusiasm of short-term bulls has spent its last lobby coffee.
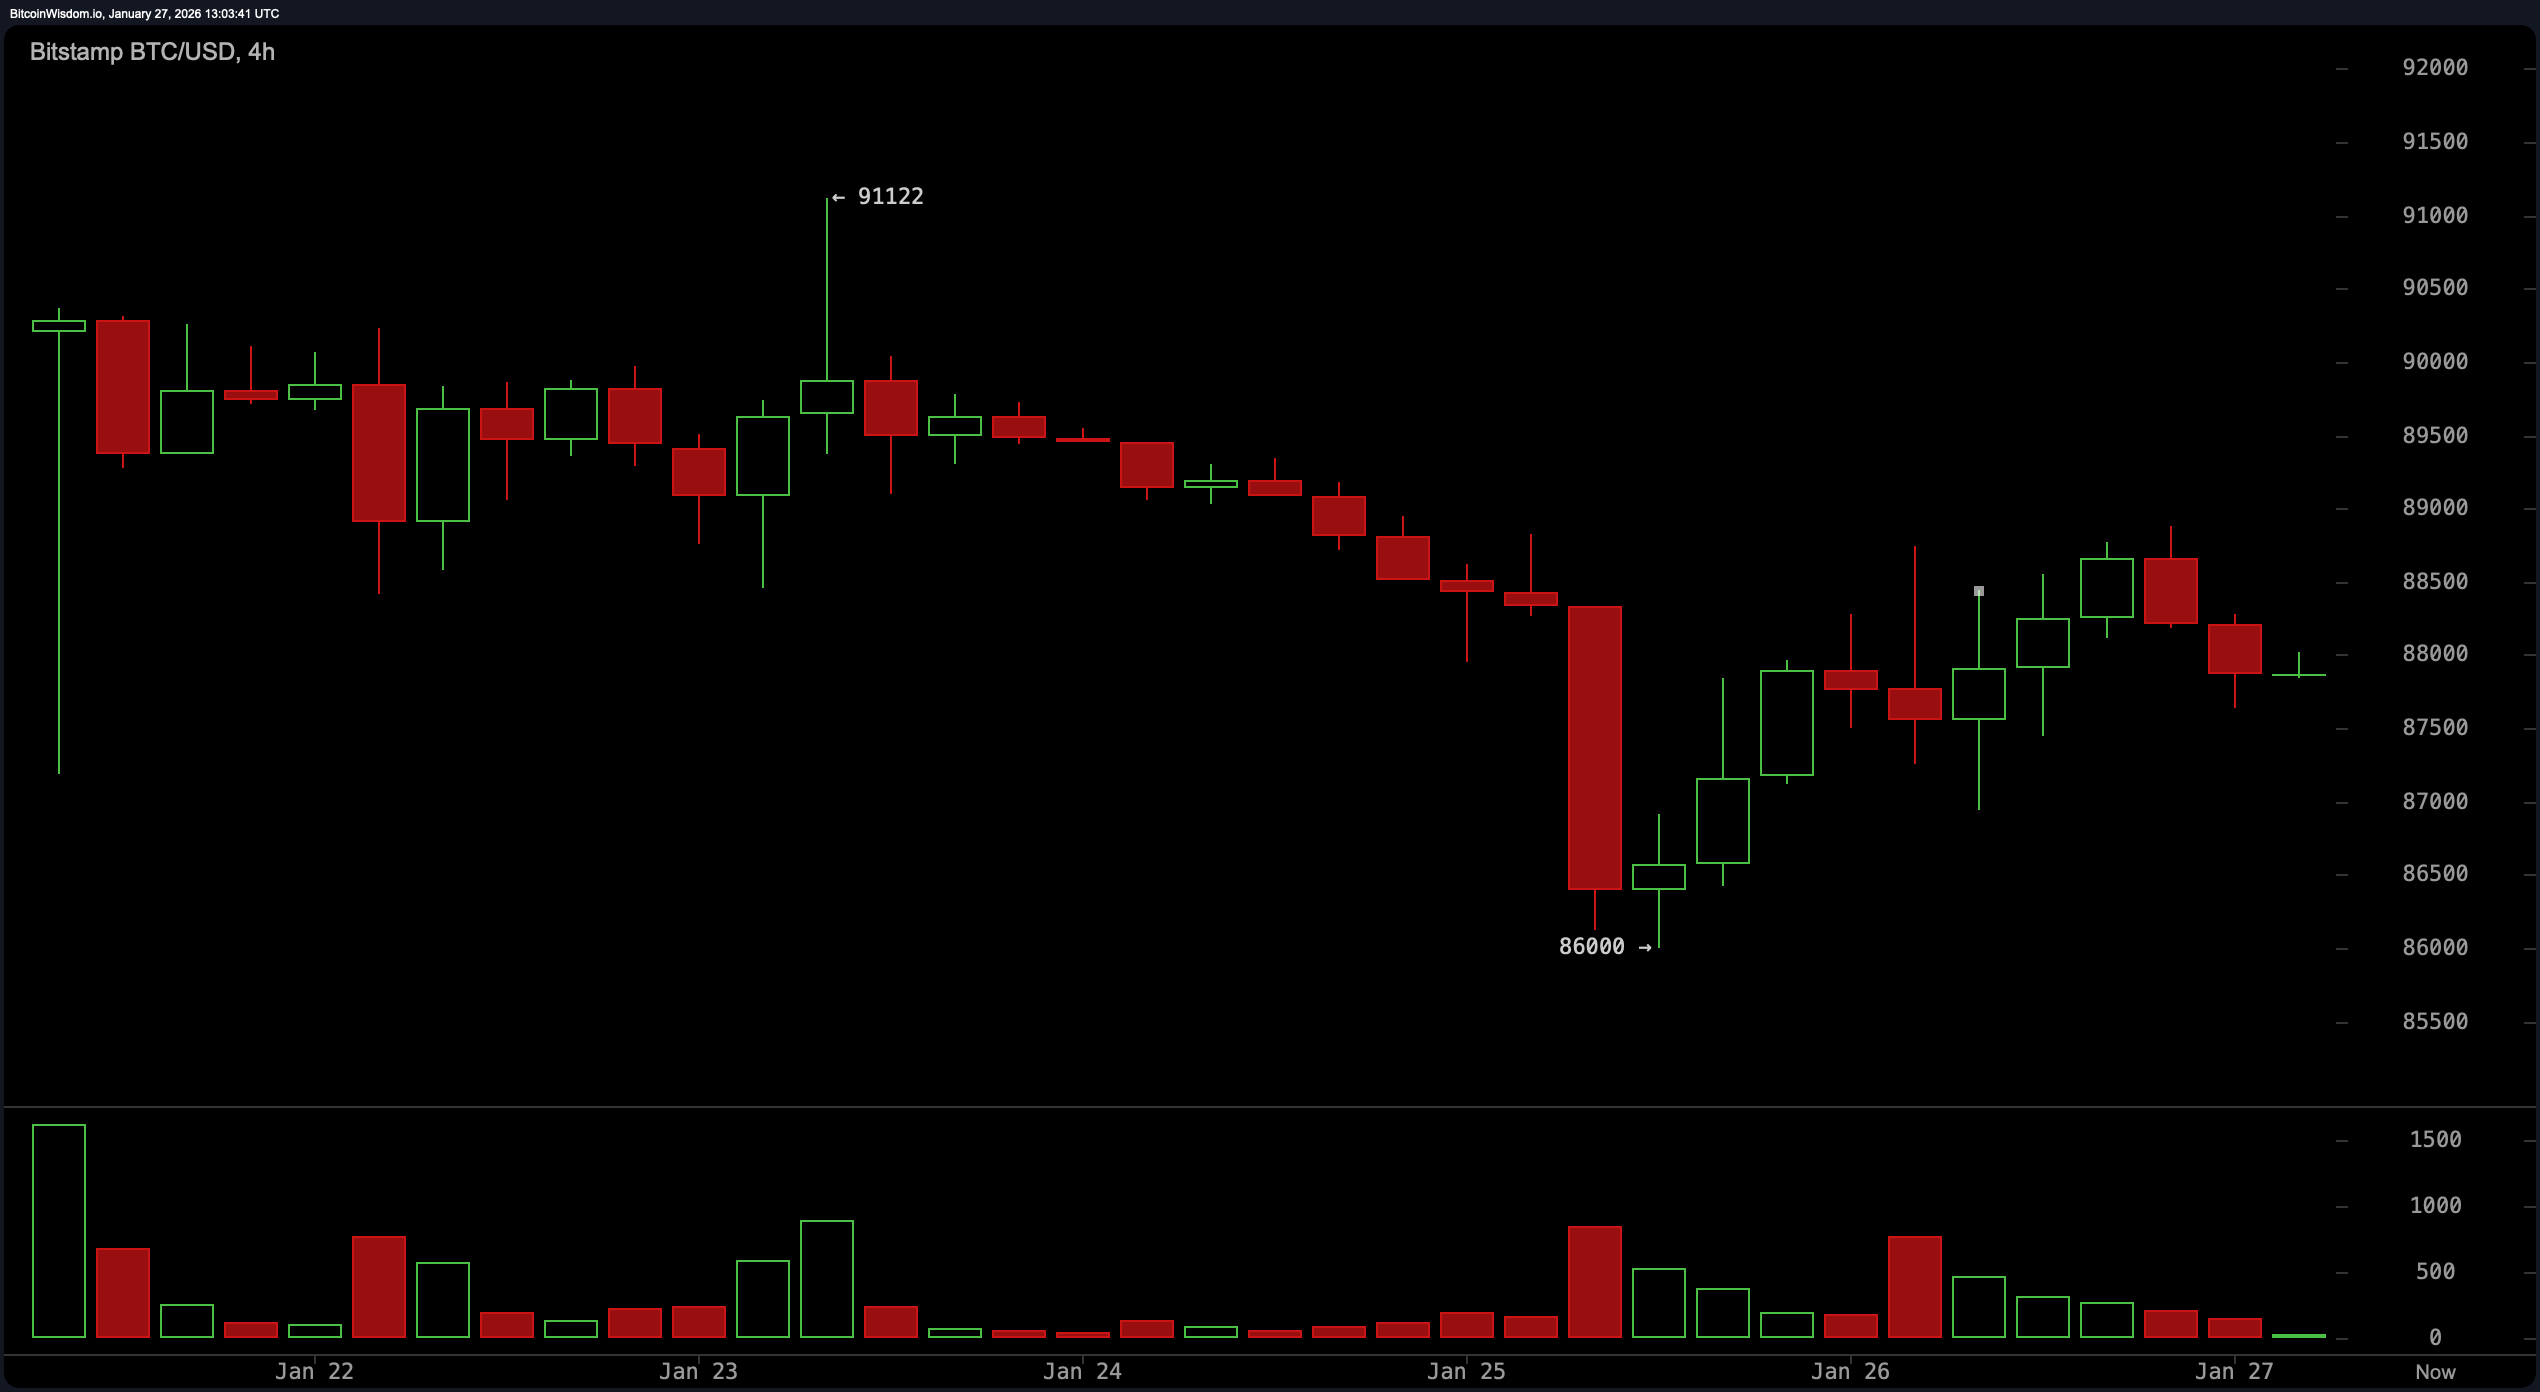
On the 4-hour chart, the mood slides from cautious sideways to a slightly forced optimism. A brutal slide to $86,000 was met with a rebound, but higher highs remain a rumor more than a reality. The price now bounces between $87,500 and $88,800, tightening like a spring that hasn’t learned its lesson. If Bitcoin breaches $89,000 with conviction (and volume to back it), there’s room to revisit the $91,000 region. A clean break under $87,500, and we’re headed back toward $86,000-perhaps with the flair of a dramatic exit.
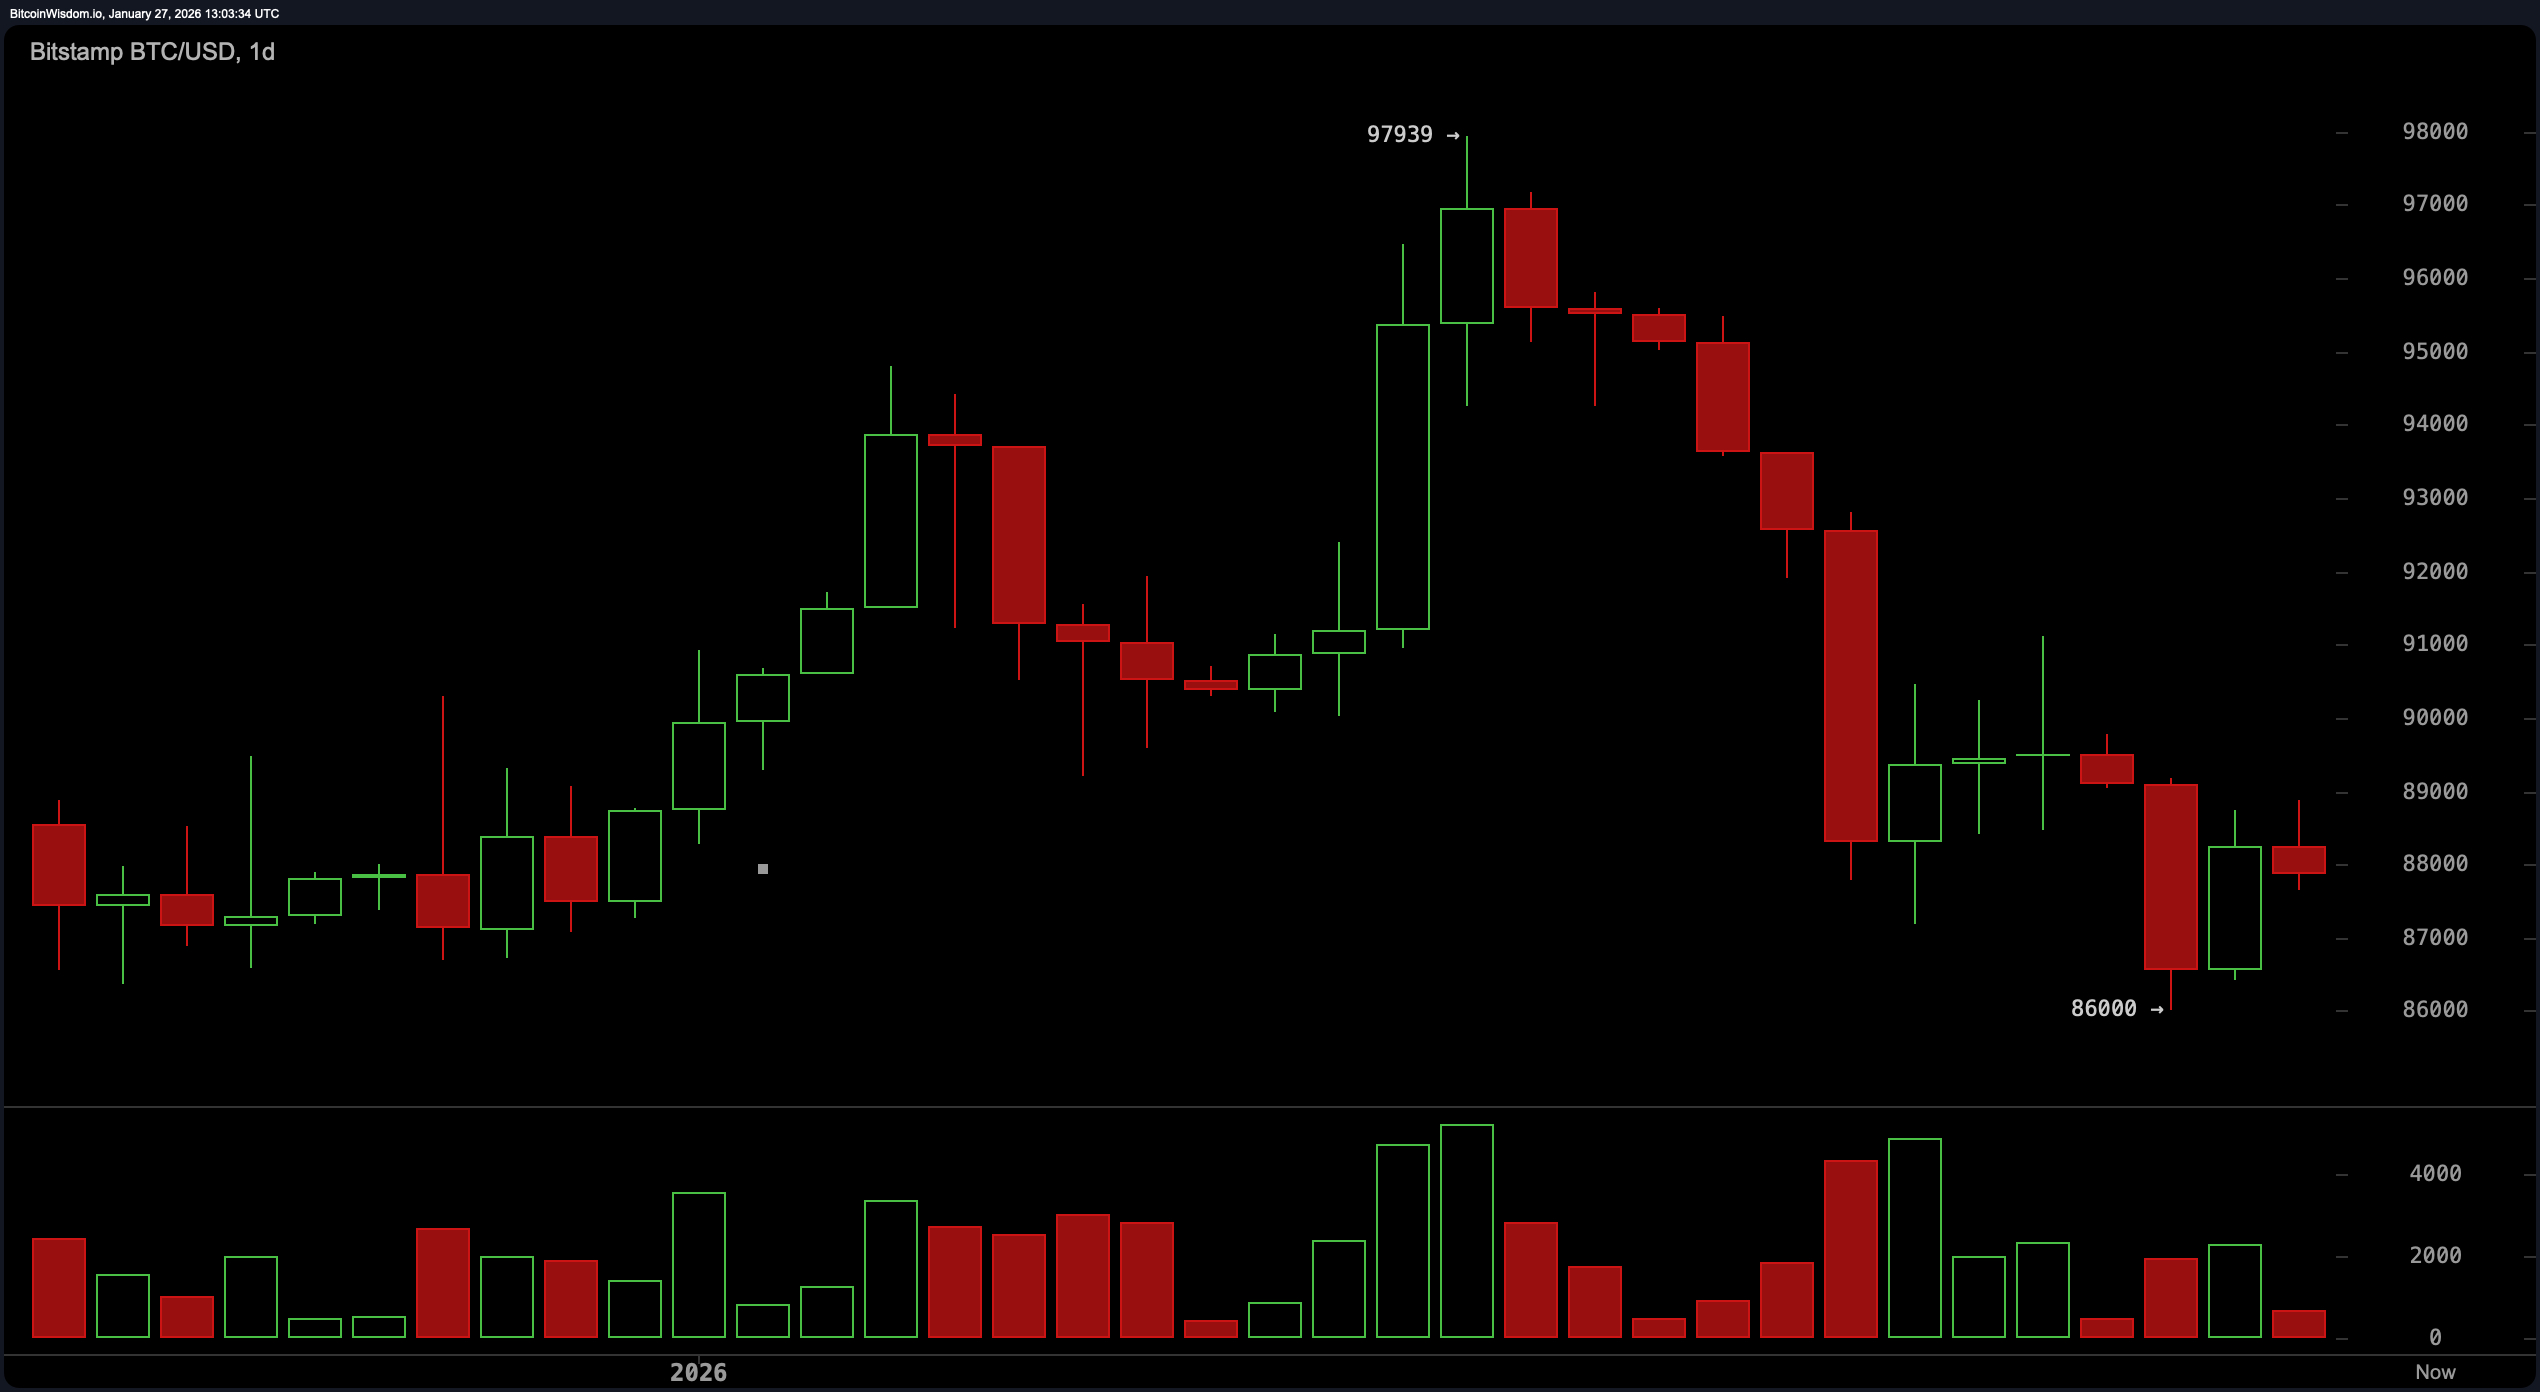
The daily chart, in turn, yawns at the viewer. After a flirt with a local high near $97,939, Bitcoin was thrust into a tide of red, heavy-volume candles-distribution, capitulation, the whole dramatic pantomime. Now it camps around the $87,000-$89,000 zone, struggling to reclaim anything meaningful. The pattern shapes up as bearish-lower highs, lower lows, and enough downward pressure to make a chartist faint. Without a convincing rally above $90,000, enthusiasm should be tempered with a stiff cocktail of realism.
Now for the real diva: the indicators. Oscillators are in neutral mode, except momentum, which hints at upward pressure-likely a tease more than a vow. The RSI is lounging at 41, still shy of a real commitment. The Stochastic sits in nap-time territory at 13, and the CCI drags in at -90. The MACD is at -762, declaring bearishness with the subtlety of a пуш in a bank lobby. It’s the kind of ensemble that says: “We look confident, we’re not.”
Moving averages? A sea of red flags. All major EMAs and SMAs from the 10-period to the 200-period lean bearish. The 10-period EMA sits at $89,379 and the 10-period SMA at $89,462, both perched above the current price, signaling downward momentum. The long-haul 200-period SMA casts a shadow from the distant past at about $104,835. Translation: until Bitcoin can muscle its way above these averages, it’s playing defense in its own half of the field.
Bull Verdict:
Should bitcoin clear $89,000 with real volume and prove its strength above $90,000, a push toward $91,000 and beyond could be plausible. Momentum is nudging in a more hopeful direction, and if buyers show up in force, this might mark the start of a short-term recovery leg within the broader downtrend.
Bear Verdict:
With every key moving average towering above the price and bearish structures ruling multiple timeframes, Bitcoin remains under heavy downward pressure. A break below $87,500, especially on strong volume, could drag price action back to the $86,000 zone or lower, extending the bearish trajectory.
FAQ 🐂🐻
- Where is bitcoin trading now?
Bitcoin is currently priced at $87,867, hovering in a narrow range between $87,180 and $88,763. - Is bitcoin showing bullish or bearish signals today?
Technical charts show a bearish bias with fading momentum and resistance across key moving averages. - What levels should traders watch near-term?
Watch $89,000 for a potential breakout and $87,500 for signs of further downside. - How is bitcoin’s volume trending today?
The 24-hour volume sits at $40.97 billion, with lower timeframes showing decreasing participation.
Read More
- Bitcoin at Halfway Through Halving: Gains Lag Behind Previous Cycles
- Silver Rate Forecast
- USD CLP PREDICTION
- WLD PREDICTION. WLD cryptocurrency
- JPY KRW PREDICTION
- XRP Holders Beware: EarnXRP’s Hidden Fees and Risks Exposed by Analyst
- BTC PREDICTION. BTC cryptocurrency
- GBP CNY PREDICTION
- Central Bank of Australia Goes Wild: CBDCs and Stablecoins Unleashed in Wholesale Markets
- TRON’s Tsar Sun Declares War on DeFi Despotism!
2026-01-27 17:19