Ethereum is currently trading around $2,284. Analysts suggest a long-term price pattern indicates it could reach $8,900 in the next market cycle. Traders are watching for resistance levels between $2,400 and $2,500.
Ethereum is currently trading around $2,284 while investors analyze both its long-term price trends and immediate market conditions.
A specific chart pattern, called an ascending triangle, has been forming over the past five years, and analysts believe it suggests the price could rise to around $8,900 in the next market cycle.
The setup is not confirmed yet, as ETH still trades below the $2,400 to $2,500 resistance range.
Five-Year Ascending Triangle Offers a Measured ETH Target
Ethereum’s price chart reveals a bullish pattern called an ascending triangle, which has been forming over the past five years.
Traders often track this structure because it can show steady buyer demand near rising support.
The measured move technique helps predict a potential price target after a breakout. It calculates the height of the pattern forming before the breakout and then projects that same distance upwards from the breakout point.
Considering its current pattern, Ethereum is likely heading towards the $8,900 level. This prediction is more conservative compared to some other forecasts which suggest prices could reach $25,000 or even $60,000.
People are already predicting wildly high prices for the next market cycle, which is pretty typical.
$25K.. $60K..
Let’s be realistic.
Currently, the most straightforward way to estimate potential gains is by tracking a breakout from the ascending triangle pattern that has been forming…
— Ardi (@ArdiNSC)
The forecast doesn’t guarantee Ethereum will hit that price. Market forces like buying and selling pressure, available funds, and overall crypto trends could cause the price to fall short or go above the predicted level.
Traders should wait for a clear breakout confirmation before considering the predicted target valid. For now, $8,900 is simply a potential technical level.
Ethereum Trades Near $2,284 as Resistance Blocks Momentum
Ethereum is currently trading around $2,284. It bounced back from a low point between $1,800 and $2,000, which provided support after a recent price drop.
I’ve observed a recent bounce, suggesting some buyers stepped in when the price dropped. However, it’s still too early to say definitively if Ethereum is starting a sustained upward trend; we haven’t seen enough confirmation of a stronger reversal yet.
Prices are currently facing a significant hurdle between $2,400 and $2,500. This level has repeatedly influenced the market direction throughout 2024.
If the price consistently closes above this current level each day, it could signal a positive shift in the short-term trend. This might then draw traders’ attention back to the $2,800 price point.
If Ethereum doesn’t rise back above $2,400 to $2,500, its price might remain stable but uncertain. Traders will likely continue to monitor key price levels before making significant moves.
Read Also:
Ethereum Range Holds Firm While Momentum Stays Weak Near Key Support
MACD and RSI Show a Market Waiting for Clear Direction
Ethereum’s market indicators currently suggest a balanced situation. The MACD is at around 23.1, and its signal line is near 39.2, indicating no strong upward or downward trend.
The histogram currently shows a value of around -16.1, suggesting some selling pressure still exists. However, this level isn’t particularly strong.
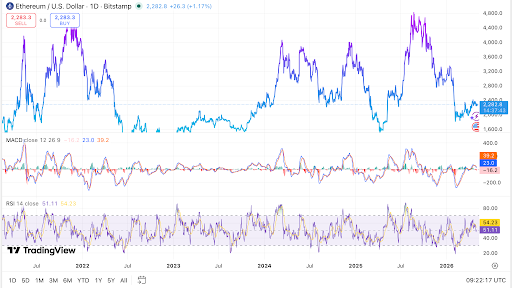
Ethereum’s Relative Strength Index (RSI) is currently around 51, with the average RSI at 54. This suggests the cryptocurrency is in a neutral position, not showing signs of being overbought.
Price support currently exists around $2,150, and more strongly at $2,000. If the price falls below $2,000, it could potentially drop to around $1,800.
Looking at the positive side, the price seems to be facing some hurdles around $2,400, $2,800, and $3,200. If the price can climb above $2,800, it would suggest a more significant rebound is underway.
Ethereum is currently fluctuating between a generally optimistic long-term outlook and some immediate challenges. A key indicator of its next move will likely be whether it can break through the $2,400 to $2,500 price range.
Read More
- Silver Rate Forecast
- Gold Rate Forecast
- USD CNY PREDICTION
- Brent Oil Forecast
- Bitcoin at Halfway Through Halving: Gains Lag Behind Previous Cycles
- USD TRY PREDICTION
- CDC Boss Plays Keep-Away with COVID Vaccine Data – Scientists Cry Foul!
- DOGE PREDICTION. DOGE cryptocurrency
- I gave up gin for this coin and made £12.42-learn the secret (you won’t believe emoji #3) 😱✨💰
- ADA PREDICTION. ADA cryptocurrency
2026-05-01 19:08