As a researcher tracking Bitcoin, I’ve observed a significant move in the last day. The price has consistently pushed above $80,000 – a level we haven’t seen since January. The big question now is whether this upward momentum is a genuine sign of a sustained price increase, or just a temporary spike that will quickly fall back down.
How Bitcoin got to $80K
Bitcoin’s price surged to $80,000 due to a significant ‘short squeeze.’ Data from CoinGlass shows that traders who were betting against the price (known as ‘short traders’) lost a total of $199.32 million in the last 24 hours as the price unexpectedly rose.
Growing interest from financial institutions is also helping Bitcoin’s price. We saw this with significant investments in Bitcoin ETFs on May 1st ($629.8 million) and May 4th ($603.14 million).
Strive has significantly increased its Bitcoin holdings, recently adding 444 BTC and bringing its total treasury to 15,000 BTC. This makes Strive the ninth largest public company worldwide to hold Bitcoin. In other news, Strategy has temporarily stopped buying Bitcoin to ensure it follows all rules and regulations before announcing its first quarter 2026 earnings on May 5th.
April was the best month so far in 2026 for crypto investments, with nearly $1.97 billion flowing into crypto treasury strategies and ETFs.
— CryptoDiffer Analytics (@CryptoDiffer) May 4, 2026
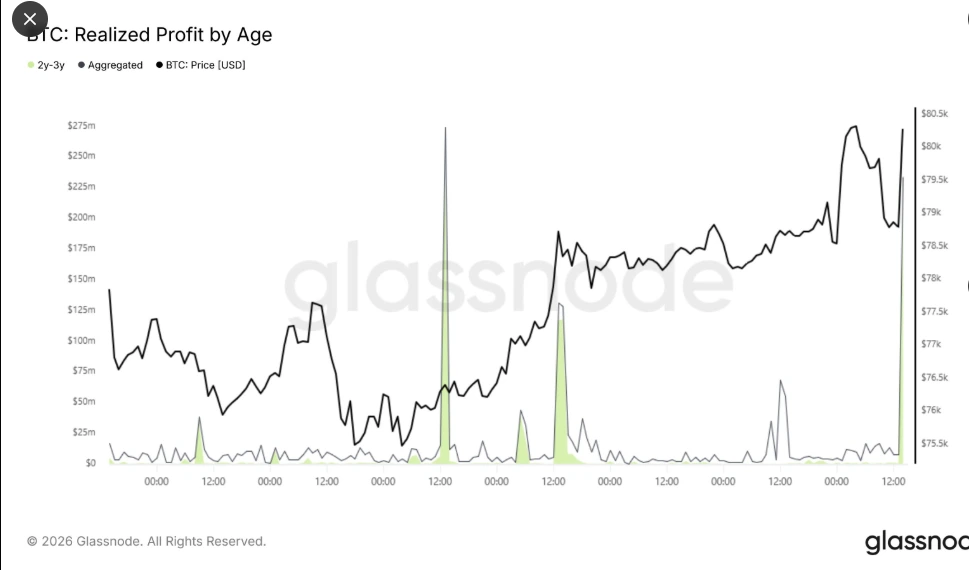
When Bitcoin’s price hit $80,000, people who had been holding it for two to three years – particularly those who bought right before the launch of Bitcoin ETFs – started selling to realize their profits. Data from Glassnode shows this group was selling at a rate of $209 million per hour, with profits ranging from 60% to 100%.
What BTC needs to confirm the bull market entrance
Bitcoin is currently struggling to stay above the $80,000 mark. If the price consistently closes above this level, it could trigger a rapid price increase, potentially pushing it up to between $84,000 and $85,500.
If Bitcoin starts making higher price peaks while its RSI indicator shows lower peaks, that could signal a shift towards an upward trend. Right now, the RSI is at 65.
Bitcoin trading activity surged on May 4th, reaching $56.51 billion in a single day, compared to $16.76 billion just two days prior. This shows a quick increase in price, but trading volume is still below levels seen during previous price jumps. For the price to continue rising steadily, we’d need to see even more trading, which would suggest strong and consistent buying from institutional investors and a healthy ability to handle increased selling pressure.
For the price to continue rising, it needs to stay above $72,352, which is the average price over the last 100 days. If the price drops, support levels can be found between $73,000 and $75,000. Falling below this range could indicate the recent price increase was a false signal.
Read More
- Silver Rate Forecast
- Bitcoin at Halfway Through Halving: Gains Lag Behind Previous Cycles
- USD CLP PREDICTION
- WLD PREDICTION. WLD cryptocurrency
- JPY KRW PREDICTION
- XRP Holders Beware: EarnXRP’s Hidden Fees and Risks Exposed by Analyst
- BTC PREDICTION. BTC cryptocurrency
- GBP CNY PREDICTION
- Whales Keep Bitcoin Afloat: $5.7 Billion Sell-Off No Match for These Titans 🐳💰
- Bitcoin Blazes Past $113k: Is the Whole Market About to Lose Its Mind?
2026-05-05 03:07