The price of XRP has slightly decreased from around $1.46. It’s currently stabilizing, and could rise again if it remains above $1.40.
- XRP price started a downside correction after it failed to clear the $1.4550 zone.
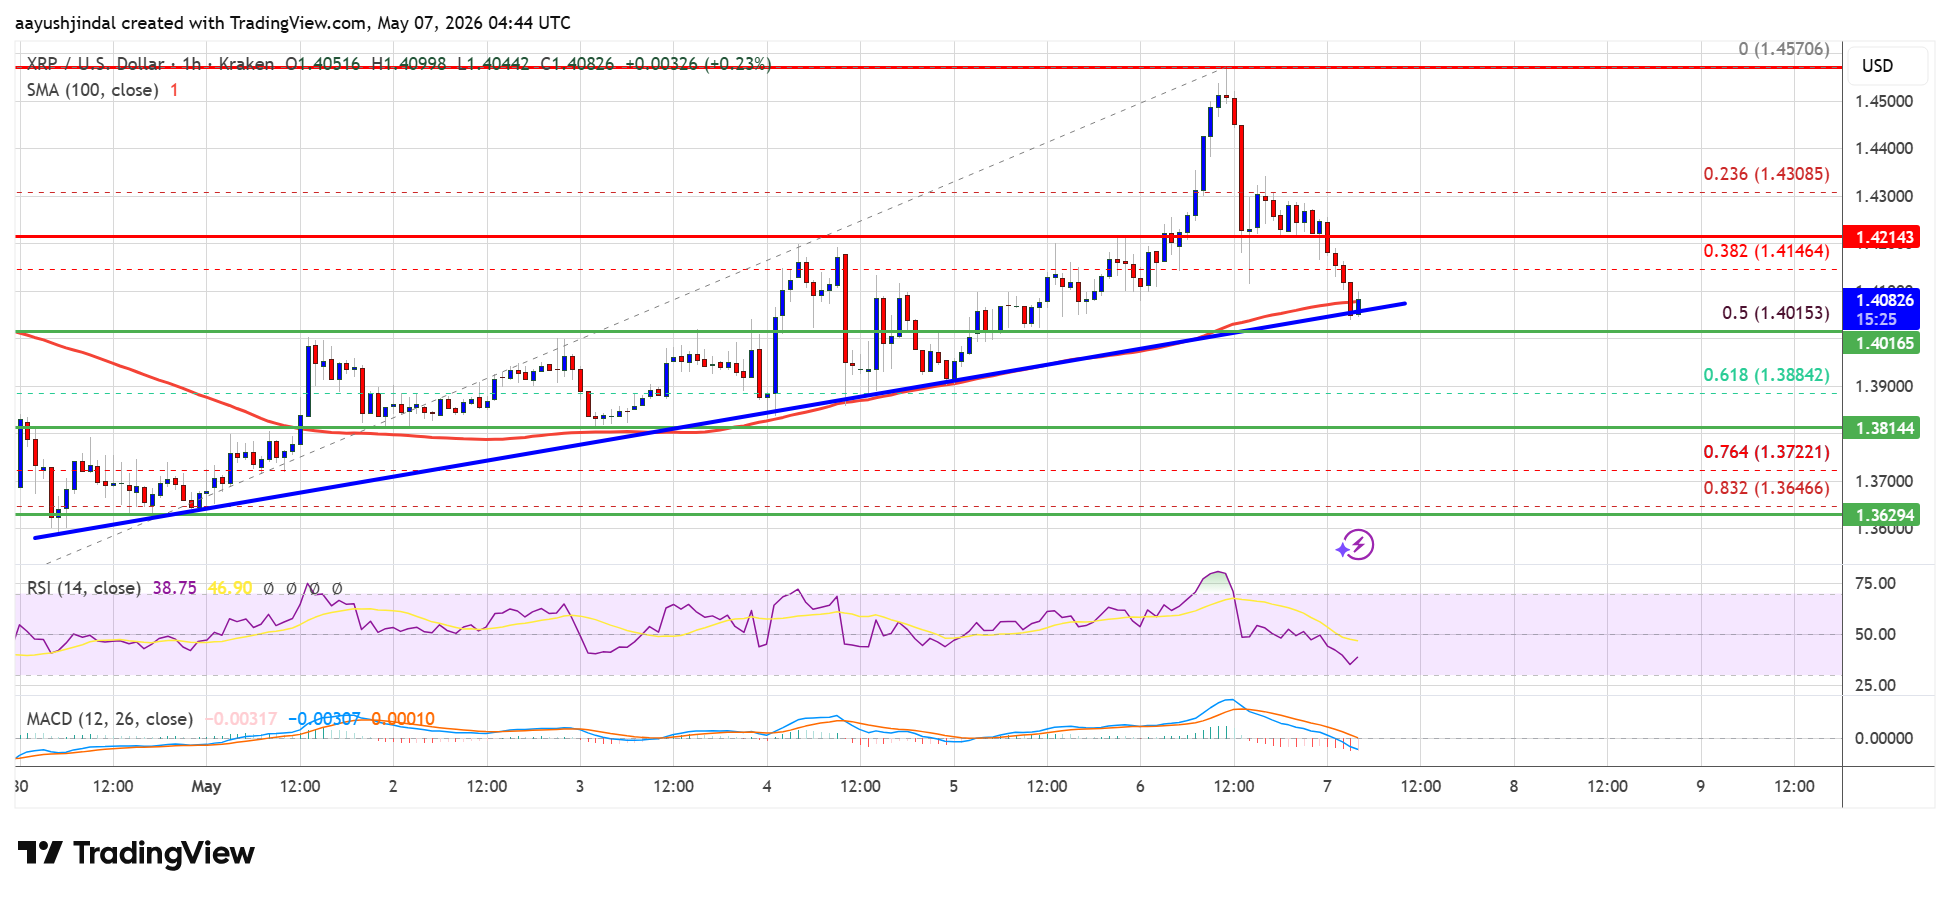
- The price is now trading near $1.4080 and the 100-hourly Simple Moving Average.
- There is a bullish trend line forming with support at $1.4050 on the hourly chart of the XRP/USD pair (data source from Kraken).
- The pair could start a fresh increase if it settles above $1.4220.
XRP Price Dips Again
Similar to Bitcoin and Ethereum, XRP’s price began to rise, breaking past the $1.3850 and $1.4150 levels. It then gained momentum, successfully moving above the $1.4220 resistance point.
The price initially reached a high of $1.4570 before starting to fall. It then broke below $1.4320 and $1.420. This decline took the price below the 38.2% Fibonacci retracement level, measured from the recent low of $1.3460 to the high of $1.4570.
The price of XRP is currently around $1.4080, close to its 100-hour moving average. A positive trend line is also developing, offering support around $1.4050 on the hourly chart.
If the price starts to rise, it could encounter some resistance around $1.42. A stronger move past $1.4220 could lead to a test of $1.4350. Breaking through $1.4350 might then push the price towards $1.4550, with potential for further gains up to $1.4620. A significant challenge for buyers likely lies near $1.4840.
Another Drop?
If XRP doesn’t break past the $1.4220 resistance level, its price might start to fall. It could initially find support around $1.3050. A stronger support level exists near $1.40, which also coincides with a trend line and the 50% retracement of the recent price swing between $1.3460 and $1.4570.
If the price falls below $1.40, it could continue dropping, potentially reaching $1.3820. Further declines might find support around $1.3620, but breaking through that could lead to $1.350. If losses continue beyond that point, the price might test the $1.3320 level.
Technical Indicators
Hourly MACD – The MACD for XRP/USD is now gaining pace in the bearish zone.
Hourly RSI (Relative Strength Index) – The RSI for XRP/USD is now below the 50 level.
Major Support Levels – $1.4050 and $1.4000.
Major Resistance Levels – $1.4220 and $1.4550.
Read More
- Bitcoin at Halfway Through Halving: Gains Lag Behind Previous Cycles
- Silver Rate Forecast
- Ethereum Reserves Dry Up as Whales Buy – Is a Supply Crunch on the Way?
- WLD PREDICTION. WLD cryptocurrency
- ICP PREDICTION. ICP cryptocurrency
- Coinbase’s Retail Resilience: Diamond Hands or Dumb Hands?
- USD CLP PREDICTION
- 🚀 Crypto Chaos: 3 Altcoins Teetering on the Edge of Oblivion! 🌋
- Binance’s Genius Contest: Who’s the Real Winner?
- Quantum Threat to Crypto Shrinks: Ripple’s XRPL Race to Post-Quantum Security by 2028
2026-05-07 08:12